빅데이터 분석가 양성과정/Python
Matplotlib(1)
분석가 황규진
2024. 7. 6. 00:43
Matplotlib
- Python Graph Visualization 으로 가장 많이 사용되는 라이브러리.
- Python Visualization에 많은 공헌을 함.
- 3차원 이상의 입체 시각화도 다양하게 지원
- 그러나 직관적이지 못한 API 로 인해 개발에 익숙해 지는데 많은 시간이 필요하며 기본 설정 환경에서 현대적인 감각이 떨어지는 Visual 개선 필요

Matplotlib.pyplot 모듈의 이해

pyplot의 두가지 중요 요소 - Figure 와 Axes

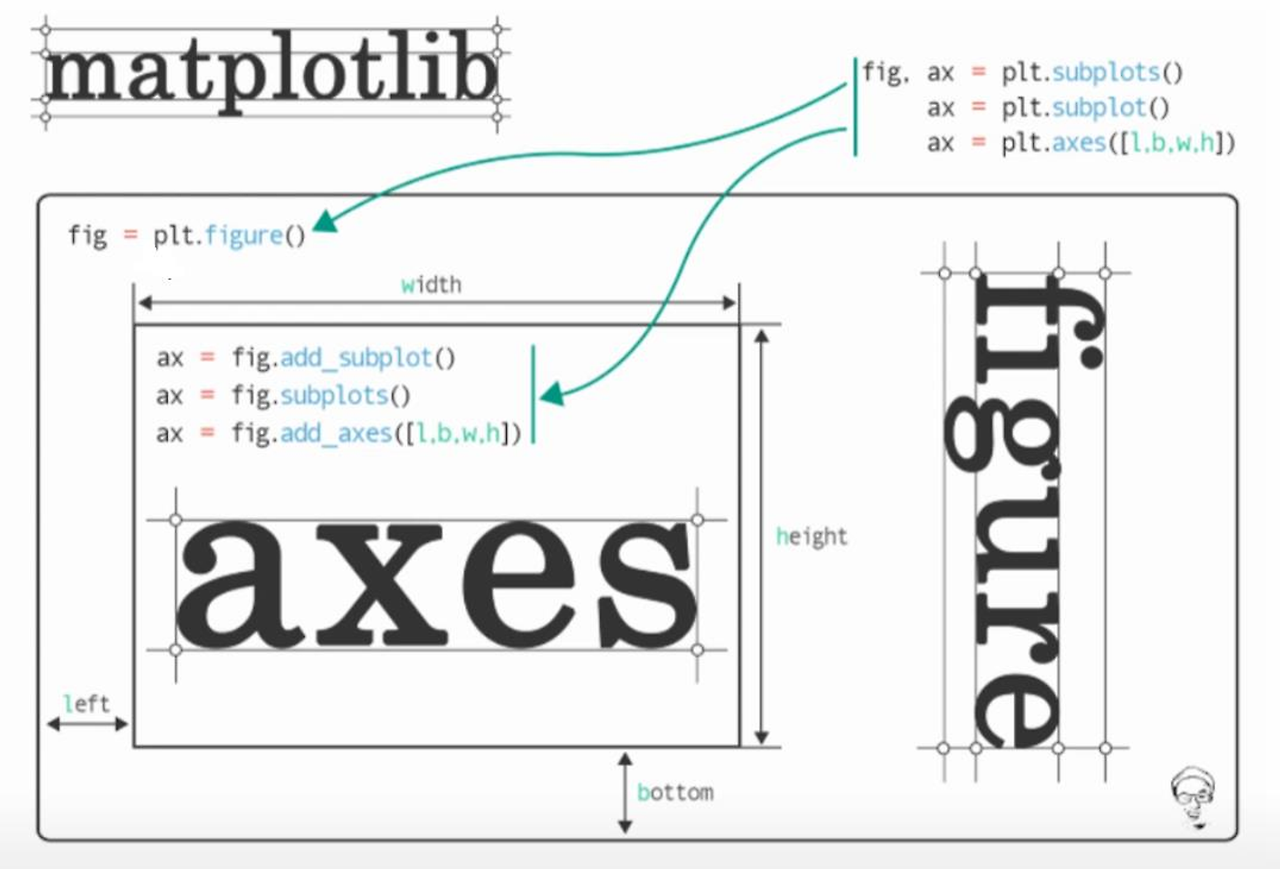

여러 개의 plot을 가지는 Figure
import matplotlib.pyplot as plt
#%matplotlib inline

plt.plot([1, 2, 3], [2, 4, 6])
plt.title("Hello plot")
plt.show()
# plt.figure()는 주로 figure의 크기를 조절하는 데 사용됨.
plt.figure(figsize=(10, 4)) # figure 크기가 가로 10, 세로 4인 Figure객체를 설정하고 반환함.

plt.plot([1, 2, 3], [2, 4, 6])
plt.title("Hello plot")
plt.show()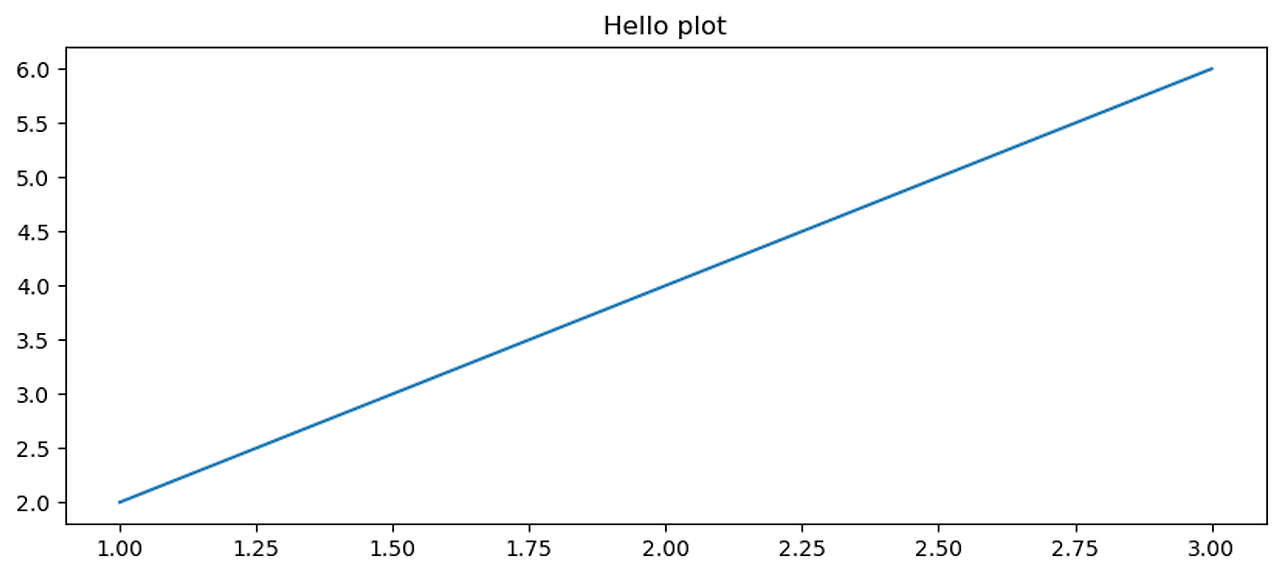
figure = plt.figure(figsize=(10, 4))
print(type(figure))
<class 'matplotlib.figure.Figure'>
<Figure size 1000x400 with 0 Axes>
plt.figure(figsize=(8,6), facecolor='yellow')
plt.plot([1, 2, 3], [2, 4, 6])
plt.title("Hello plot")
plt.show()
ax = plt.axes()
print(type(ax))
### pyplot에서 설정된 Figure와 Axes 객체를 함께 가져오기

fig, ax = plt.subplots()
print(type(fig), type(ax))
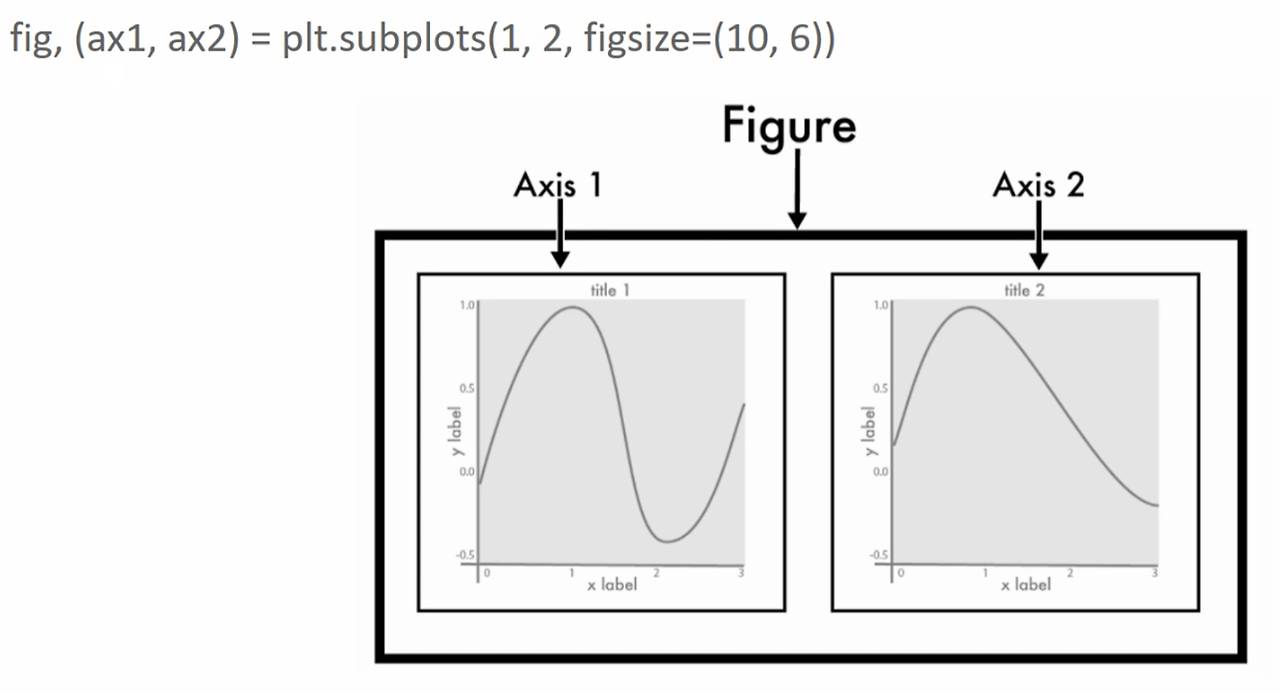
여러개의 plot을 가지는 figure 설정
fig, (ax1, ax2) = plt.subplots(nrows=1, ncols=2, figsize=(10, 6))
import numpy as np

x_value = [1, 2, 3, 4]
y_value = [2, 4, 6, 8]
x_value = np.array([1, 2, 3, 4])
y_value = np.array([2, 4, 6, 8])

# 입력값으로 파이썬 리스트, numpy array 가능. x축값과 y축값은 모두 같은 크기를 가져야 함.
plt.plot(x_value, y_value)
import pandas as pd

df = pd.DataFrame({'x_value':[1, 2, 3, 4],
                   'y_value':[2, 4, 6, 8]})

# 입력값으로 pandas Series 및 DataFrame도 가능.
plt.plot(df['x_value'], df['y_value'])
plt.plot(x_value, y_value, color='green')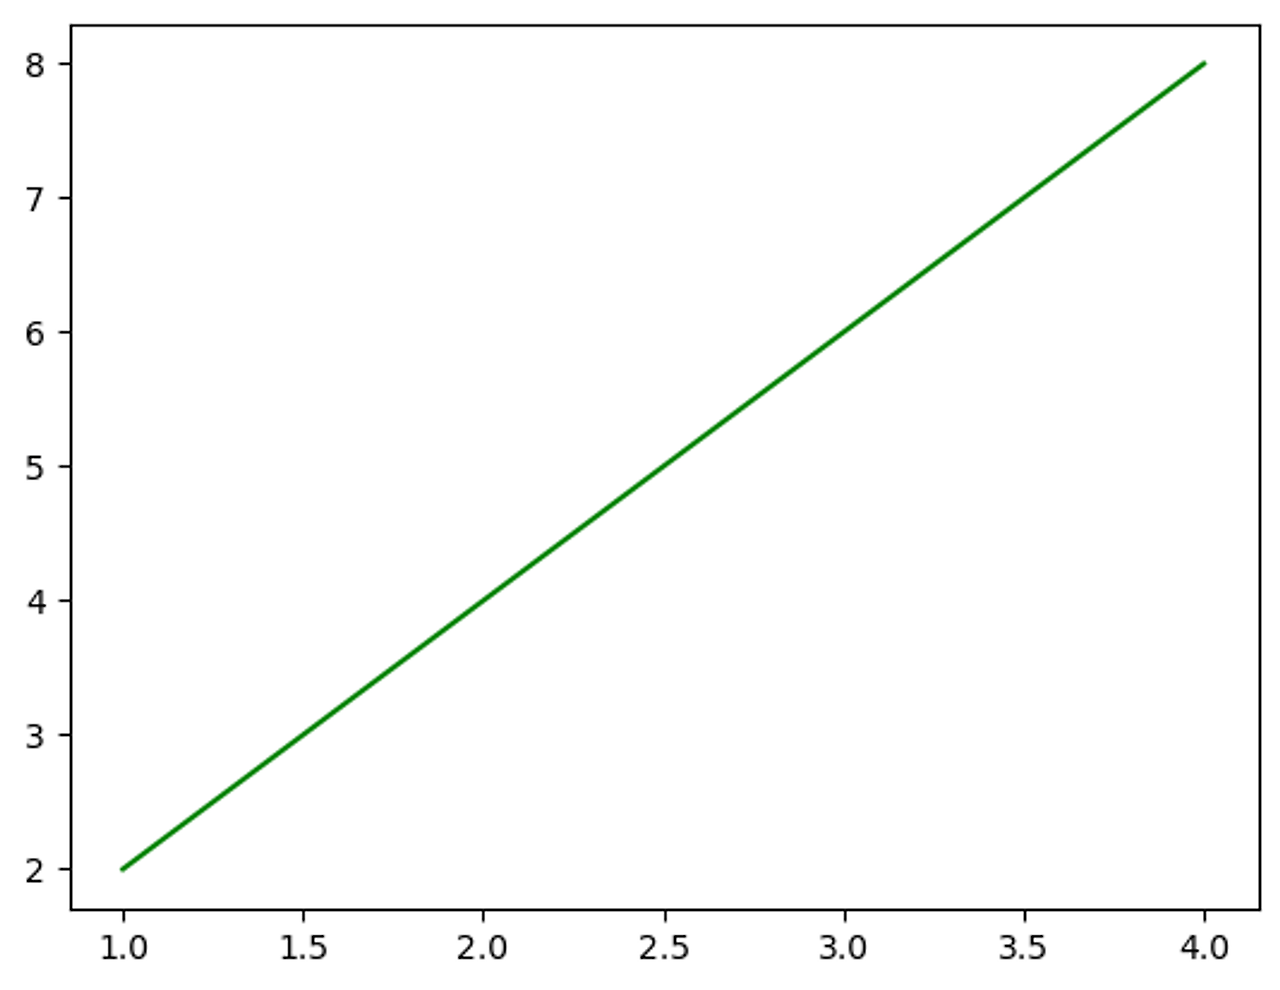
# API 기반으로 시각화를 구현할 때는 함수의 인자들에 대해서 알고 있어야 하는 부작용(?)이 있음.
plt.plot(x_value, y_value, color='red', marker='o', linestyle='dashed', linewidth=2, markersize=12)