빅데이터 분석가 양성과정/Python
plotly - 선 그래프
분석가 황규진
2024. 7. 8. 13:16
import numpy as np
import pandas as pd

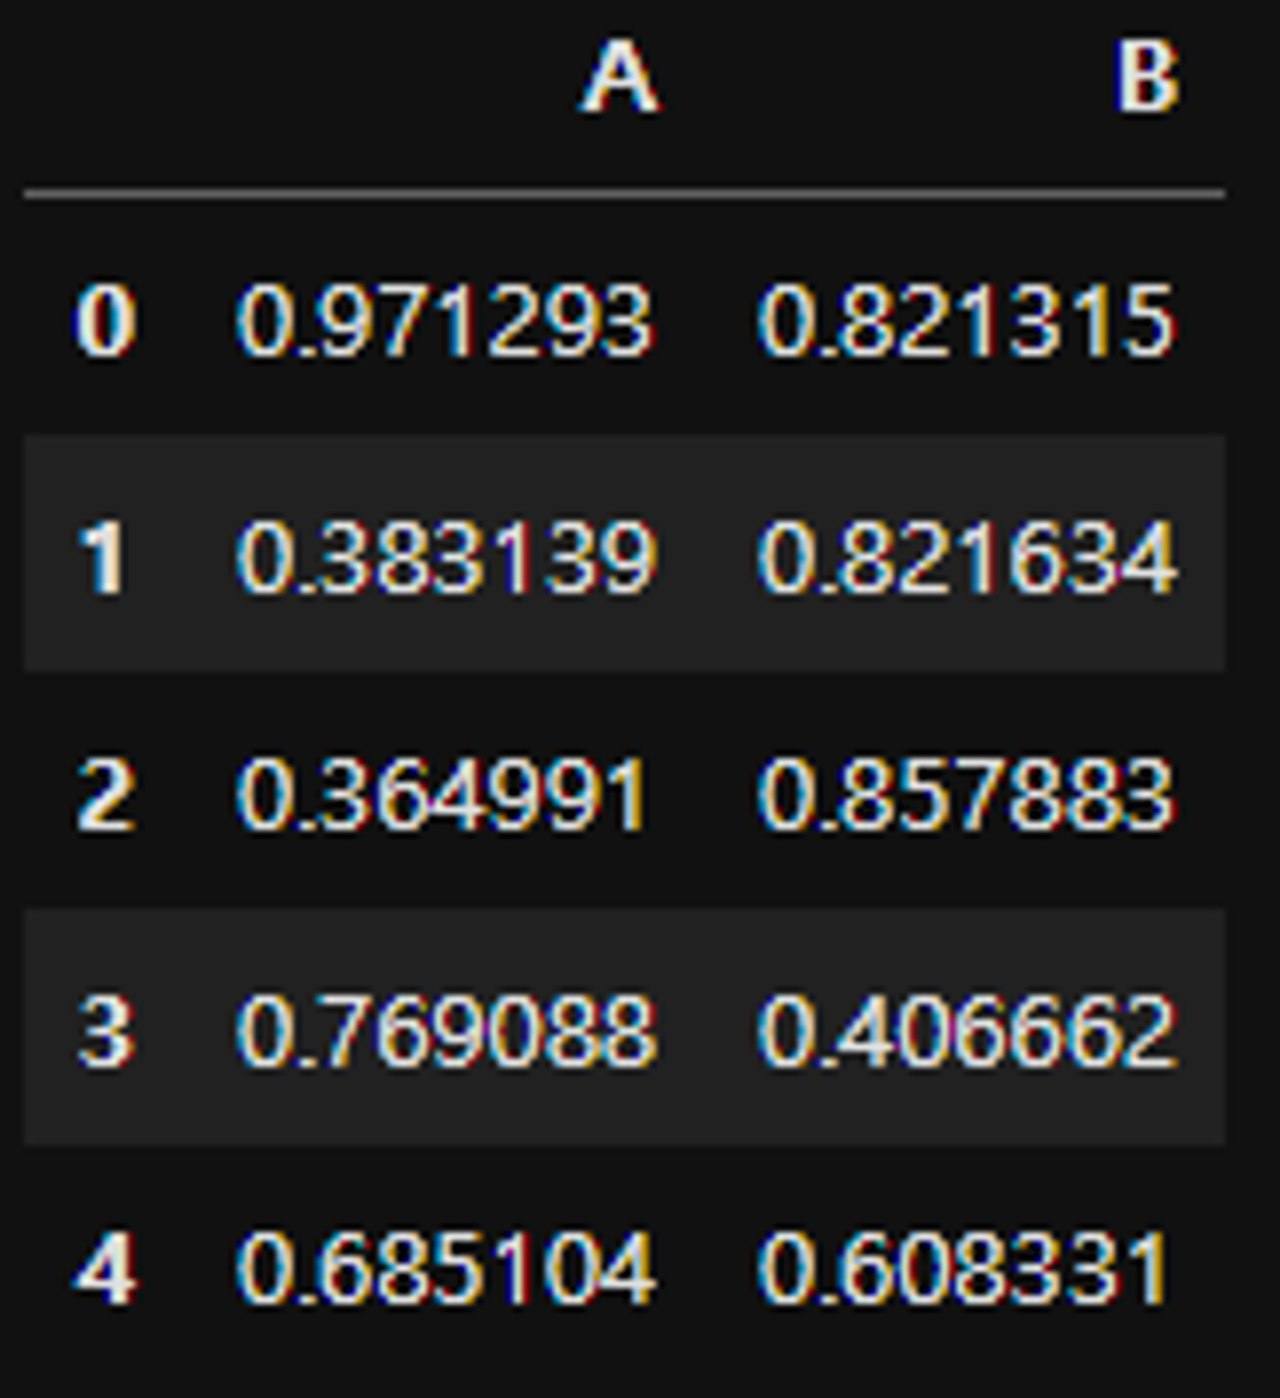
df = pd.DataFrame(np.random.rand(10, 2), columns=['A', 'B'])
df.head()
-
- fig = go.Figure() 로 기본 객체를 만들고
- fig.add_trace() 에 그래프 객체(예: go.Scatter()) 를 추가 (여러 데이터의 경우, 각 데이터별로 추가 필요)
- fig.update_layout() 으로 layout 업데이트 필요시 업데이트 fig.update_annotation() 으로 annotation 필요시 업데이트 데이터는 사전 형태로 넣는 것이 가장 쉬움 각 필드 확인: https://plotly.com/python/reference/
- fig.show() 로 그래프를 보여줌
import plotly.graph_objects as go fig = go.Figure() fig.add_trace( go.Scatter( x=df.index, y=df['A'] ) ) fig.update_layout( { "title": { "text": "Graph with go.Scatter", "font": { "size": 15 } }, "showlegend": True, "xaxis": { "title": "random number" }, "yaxis": { "title": "A" } } ) fig.show()
- 패턴 코드로 라인 그래프 그리기
- 패턴으로 복합 라인(line) 그래프
- fig = go.Figure() 로 기본 객체를 만들고
- fig.add_trace() 에 그래프 객체(예: go.Scatter()) 를 추가 (여러 데이터의 경우, 각 데이터 별로 추가 필요)
- fig.update_layout() 으로 layout 업데이트 필요 시 업데이트 fig.update_annotation() 으로 annotation 필요 시 업데이트 데이터는 사전 형태로 넣는 것이 가장 쉬움 각 필드 확인: https://plotly.com/python/reference/
- fig.show() 로 그래프를 보여줌
import plotly.graph_objects as go fig = go.Figure() fig.add_trace( go.Scatter( x=df.index, y=df['B'], mode='lines', name='A' ) ) fig.add_trace( go.Scatter( x=df.index, y=df['A'], mode='lines+markers+text', name='B', text=df.index, textposition='top center' ) ) fig.show()