빅데이터 분석가 양성과정/Python
시각화 이용한 탐색적 데이터 분석(5)
분석가 황규진
2024. 7. 8. 14:03
8. 테이블 데이터와 시계열 데이터
- 테이블 데이터 : 엑셀과 같이 행과 열로 나타낸 데이터
- feature: 테이블의 각 열을 의미
- record: 테이블의 각 행을 의미
- index: 각 데이터 위치를 식별하기 위한 값
- 시계열 데이터: 일정 시간 간격으로 배치된 데이터 (시간에 종속된 데이터)
- 이외에도 다양한 형태의 데이터가 있을 수 있으나, 대부분 테이블 데이터 형태로 처리 가능
9. 시계열 데이터 시각화를 위한 사전 준비
- pd.date_range(start='2020-01-01', end='2020-12-31')
- freq='3M': 3개월
- freq='D': 1일
- periods=10: start와 end 사이 균등 시간 분할
- 참고: https://pandas.pydata.org/pandasdocs/stable/reference/api/pandas.date_range.html
pd.date_range(start='2020-01-01', end='2020-12-31')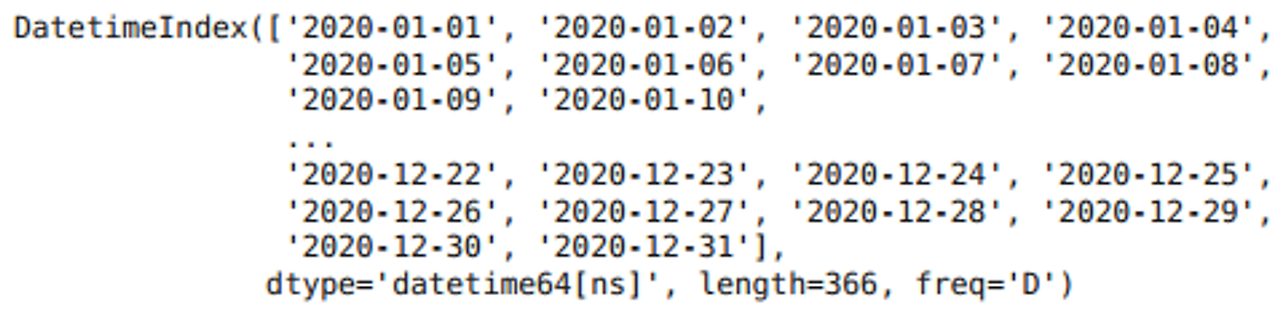
pd.date_range(start='2020-01-01', end='2020-12-31', periods=3)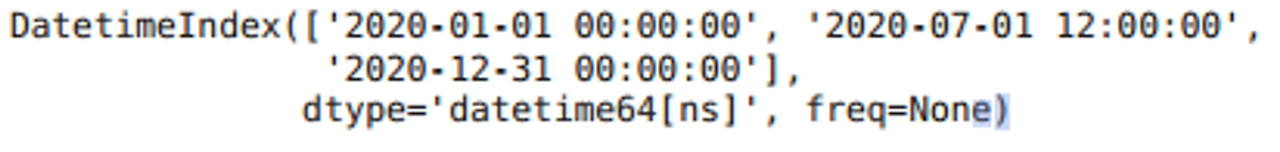
pd.date_range(start='2020-01-01', end='2020-12-31', freq='3M')
pandas Dataframe 작성 방법 정리
- pd.DataFrame(data={컬럼이름:컬럼데이터리스트})
- {컬럼이름:컬럼데이터리스트} 는 사전 데이터 형식
- pd.DataFrame(data=리스트, columns=컬럼이름, index=인덱스데이터)
import numpy as np
import pandas as pd
date_index = pd.date_range('2020-05-01', periods=15)
df = pd.DataFrame(data=range(len(date_index)), columns=['count'], index=date_index)
df
10. 시계열 데이터를 위해 주로 사용되는 그래프 타입
라인 그래프
import chart_studio.plotly as py
import cufflinks as cf
cf.go_offline(connected=True)
df.iplot(kind='line')
막대 그래프
df.iplot(kind='bar')
