빅데이터 분석가 양성과정/Python - 머신러닝
군집화 (K-Means)
황규진
2024. 7. 12. 15:27
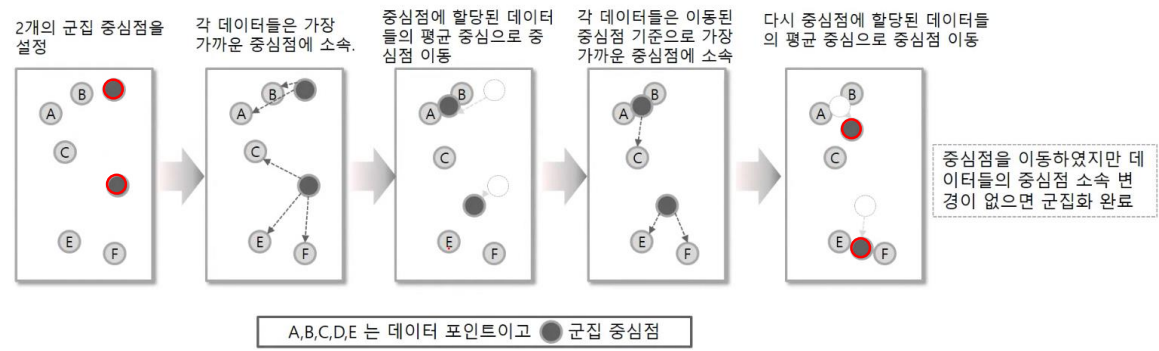
K-Means clustering
- 군집 중심점 기반 클러스터
장점
- 일반적인 군집화에서 가장 많이 활용
- 쉽고 간결함
- 대용량 데이터에도 활용 가능
단점
- 거리 기반 알고리즘으로 속성 개수 매우 많을 경우 정확도 떨어짐(차원의 저주)
- 반복 수행 하는데, 횟수 많을 경우 수행 시간 느려짐
- 이상치(Outlier) 데이터에 취약

주요 파라미터
- n_cluster : 군집화 할 개수, 즉 군집 중심점의 개수 의미
- init : 초기 군집 중심점 좌표 설정 방식. 일반적으로 k-means++방식 최초 설정
- max_iter : 최대 반복 횟수, 이 횟수 이전 모든 데이터의 중심점 이동 없으면 종료
주요 속성
- labels_ : 각 데이터 포인트가 속한 군집 중심점 레이블
- cluster_centers_ : 각 군집 중심점 좌표. 이를 이용하면 군집 중심점 좌표 어디인지 시각화
실습) 붓꽃 데이터 K-Means clustering
from sklearn.preprocessing import scale
from sklearn.datasets import load_iris
from sklearn.cluster import KMeans
import matplotlib.pyplot as plt
import numpy as np
import pandas as pd
%matplotlib inline
iris = load_iris()
# 보다 편리한 데이터 Handling을 위해 DataFrame으로 변환
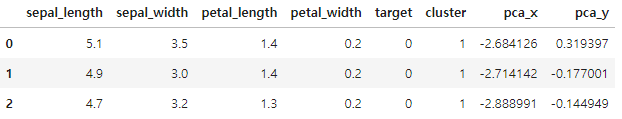
irisDF = pd.DataFrame(data=iris.data, columns=['sepal_length','sepal_width','petal_length','petal_width'])
irisDF.head(3)

kmeans = KMeans(n_clusters=3, init='k-means++', max_iter=300,random_state=0)
kmeans.fit(irisDF)
KMeans(n_clusters=3, random_state=0)
print(kmeans.labels_)
[1 1 1 1 1 1 1 1 1 1 1 1 1 1 1 1 1 1 1 1 1 1 1 1 1 1 1 1 1 1 1 1 1 1 1 1 1
1 1 1 1 1 1 1 1 1 1 1 1 1 0 0 2 0 0 0 0 0 0 0 0 0 0 0 0 0 0 0 0 0 0 0 0 0
0 0 0 2 0 0 0 0 0 0 0 0 0 0 0 0 0 0 0 0 0 0 0 0 0 0 2 0 2 2 2 2 0 2 2 2 2
2 2 0 0 2 2 2 2 0 2 0 2 0 2 2 0 0 2 2 2 2 2 0 2 2 2 2 0 2 2 2 0 2 2 2 0 2
2 0]
# irisDF['cluster']=kmeans.labels_

irisDF['target'] = iris.target
irisDF['cluster']=kmeans.labels_
iris_result = irisDF.groupby(['target','cluster'])['sepal_length'].count()
print(iris_result)
target cluster
0 1 50
1 0 48
2 2
2 0 14
2 36
Name: sepal_length, dtype: int64
from sklearn.decomposition import PCA

pca = PCA(n_components=2)
pca_transformed = pca.fit_transform(iris.data)

irisDF['pca_x'] = pca_transformed[:,0]
irisDF['pca_y'] = pca_transformed[:,1]
irisDF.head(3)
# cluster 값이 0, 1, 2 인 경우마다 별도의 Index로 추출
marker0_ind = irisDF[irisDF['cluster']==0].index
marker1_ind = irisDF[irisDF['cluster']==1].index
marker2_ind = irisDF[irisDF['cluster']==2].index
# cluster값 0, 1, 2에 해당하는 Index로 각 cluster 레벨의 pca_x, pca_y 값 추출. o, s, ^ 로 marker 표시
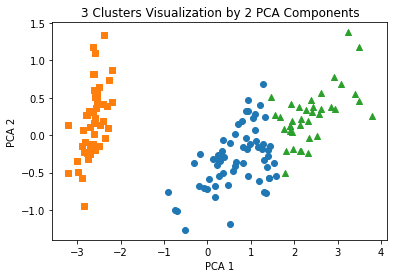
plt.scatter(x=irisDF.loc[marker0_ind,'pca_x'], y=irisDF.loc[marker0_ind,'pca_y'], marker='o')
plt.scatter(x=irisDF.loc[marker1_ind,'pca_x'], y=irisDF.loc[marker1_ind,'pca_y'], marker='s')
plt.scatter(x=irisDF.loc[marker2_ind,'pca_x'], y=irisDF.loc[marker2_ind,'pca_y'], marker='^')
plt.xlabel('PCA 1')
plt.ylabel('PCA 2')
plt.title('3 Clusters Visualization by 2 PCA Components')
plt.show()
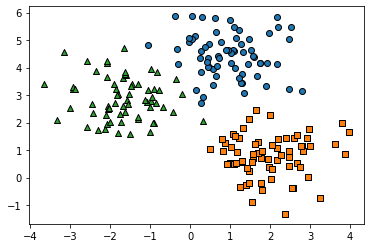
실습 - Clustering 알고리즘 테스트
import numpy as np
import matplotlib.pyplot as plt
from sklearn.cluster import KMeans
from sklearn.datasets import make_blobs
%matplotlib inline

X, y = make_blobs(n_samples=200, n_features=2, centers=3, cluster_std=0.8, random_state=0)
print(X.shape, y.shape)

# y target 값의 분포를 확인
unique, counts = np.unique(y, return_counts=True)
print(unique,counts)
(200, 2) (200,)
[0 1 2] [67 67 66]
import pandas as pd
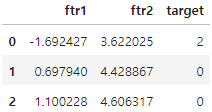
clusterDF = pd.DataFrame(data=X, columns=['ftr1', 'ftr2'])
clusterDF['target'] = y
clusterDF.head(3)
target_list = np.unique(y)
# 각 target별 scatter plot 의 marker 값들.
markers=['o', 's', '^', 'P','D','H','x']
# 3개의 cluster 영역으로 구분한 데이터 셋을 생성했으므로 target_list는 [0,1,2]
# target==0, target==1, target==2 로 scatter plot을 marker별로 생성.
for target in target_list:
    target_cluster = clusterDF[clusterDF['target']==target]
    plt.scatter(x=target_cluster['ftr1'], y=target_cluster['ftr2'], edgecolor='k', marker=markers[target] )
plt.show()
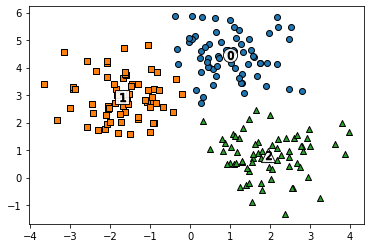
# KMeans 객체를 이용하여 X 데이터를 K-Means 클러스터링 수행
kmeans = KMeans(n_clusters=3, init='k-means++', max_iter=200, random_state=0)
cluster_labels = kmeans.fit_predict(X)
clusterDF['kmeans_label']  = cluster_labels

#cluster_centers_ 는 개별 클러스터의 중심 위치 좌표 시각화를 위해 추출
centers = kmeans.cluster_centers_
unique_labels = np.unique(cluster_labels)
markers=['o', 's', '^', 'P','D','H','x']

# 군집된 label 유형별로 iteration 하면서 marker 별로 scatter plot 수행.
for label in unique_labels:
    label_cluster = clusterDF[clusterDF['kmeans_label']==label]
    center_x_y = centers[label]
    plt.scatter(x=label_cluster['ftr1'], y=label_cluster['ftr2'], edgecolor='k',
                marker=markers[label] )

    # 군집별 중심 위치 좌표 시각화
    plt.scatter(x=center_x_y[0], y=center_x_y[1], s=200, color='white',
                alpha=0.9, edgecolor='k', marker=markers[label])
    plt.scatter(x=center_x_y[0], y=center_x_y[1], s=70, color='k', edgecolor='k',
                marker='$%d$' % label)

plt.show()
print(clusterDF.groupby('target')['kmeans_label'].value_counts())
target kmeans_label
0 0 66
1 1
1 2 67
2 1 65
2 1
Name: kmeans_label, dtype: int64