인구 공공 데이터 (시각화)
1.1 데이터 가져오기
행정안전부
행정안전부 홈페이지에 오신것을 환영합니다.
www.mois.go.kr
import csv
f = open('age.csv', encoding='cp949')
data = csv.reader(f)
next(data)

for row in data:
    if row[0] =='경상북도 안동시 명륜동(4717052000)':
        break

print(row)
f.close()
['경상북도 안동시 명륜동(4717052000)', '4,862', '4,862', '14', '14', '21', '17', '19', '29', '22', '34', '24', '30', '37', '39', '36', '38', '32', '44', '46', '34', '43', '49', '52', '49', '39', '50', '36', '44', '39', '58', '47', '48', '50', '44', '35', '30', '38', '30', '46', '29', '28', '44', '52', '43', '66', '68', '61', '84', '63', '82', '79', '68', '79', '69', '82', '94', '86', '86', '108', '86', '97', '94', '130', '96', '115', '102', '77', '100', '84', '84', '91', '67', '79', '56', '52', '57', '63', '50', '53', '33', '46', '63', '59', '59', '43', '42', '26', '24', '18', '22', '8', '12', '17', '7', '5', '6', '5', '2', '2', '0', '0', '0', '2']
data에서 거주하고 있는 곳의 데이터 찾기가 번거롭다. 위 코드 수정
import csv
f = open('age.csv', encoding='cp949')
data = csv.reader(f)
next(data)

for row in data:
    if '안동시 명륜동' in row[0]:
        print(row)

f.close()
['경상북도 안동시 명륜동(4717052000)', '4,862', '4,862', '14', '14', '21', '17', '19', '29', '22', '34', '24', '30', '37', '39', '36', '38', '32', '44', '46', '34', '43', '49', '52', '49', '39', '50', '36', '44', '39', '58', '47', '48', '50', '44', '35', '30', '38', '30', '46', '29', '28', '44', '52', '43', '66', '68', '61', '84', '63', '82', '79', '68', '79', '69', '82', '94', '86', '86', '108', '86', '97', '94', '130', '96', '115', '102', '77', '100', '84', '84', '91', '67', '79', '56', '52', '57', '63', '50', '53', '33', '46', '63', '59', '59', '43', '42', '26', '24', '18', '22', '8', '12', '17', '7', '5', '6', '5', '2', '2', '0', '0', '0', '2']
연령 대 별 인구수를 추출하는 코드
import csv
f = open('age.csv', encoding='cp949')
data = csv.reader(f)
next(data)

for row in data:
    if '안동시 명륜동' in row[0]:
        print(row)

f.close()

population = []

for p in row[3:]:
    population.append(int(p.replace(',','')))

print(population)

plt.figure(figsize = (16, 9))
plt.plot(population)
plt.xlabel('연령대')
plt.ylabel('인구수')
plt.title('연령대별 인구수(안동시 명륜동)')
plt.grid()
plt.show()

두 지역 인구 분포 비교
import csv
f = open('age.csv', encoding='cp949')
data = csv.reader(f)
next(data)

data = list(data) # 리스트로 바꿔주지 않으면 for문 돌리고 난 후 데이터 없어짐

for row in data:
    if '동백2동' in row[0]:
        print(row)
        break

population = []

for p in row[3:]:
    population.append(int(p.replace(',','')))

plt.plot(range(0,101), population, color = 'r')


for row in data:
    if '동탄5동' in row[0]:
        print(row)
        break

population = []

for p in row[3:]:
    population.append(int(p.replace(',','')))

plt.plot(range(0,101), population, color = 'b')

다양한 형태 시각화
import csv
import matplotlib.pyplot as plt
import koreanize_matplotlib

f = open('age_202306.csv', encoding='cp949')
data = csv.reader(f)
next(data)
############################################################
data = list(data)
############################################################
f.close()

count = 0

while True:
  name = input('어느 동(행정구역) 정보를 알고 싶으세요? 행정구역 이름 또는 동명을 입력해주세요 ')
  for row in list(data):
    if name in row[0]:
      count += 1
      my_town_data = row

  if count == 0:
    print('입력하신 행정구역 이름 또는 동 이름이 검색되지 않습니다. 다시 입력해주세요')
  elif count == 1:
    break
  else:
    print('입력하신 행정구역 이름 또는 동 이름이 {}개 이상 검색되었습니다. 다시 입력해주세요'.format(count))
    count = 0
    lst = []

population = []
for p in my_town_data[3:]:
  population.append( int( p.replace(',','') ) )

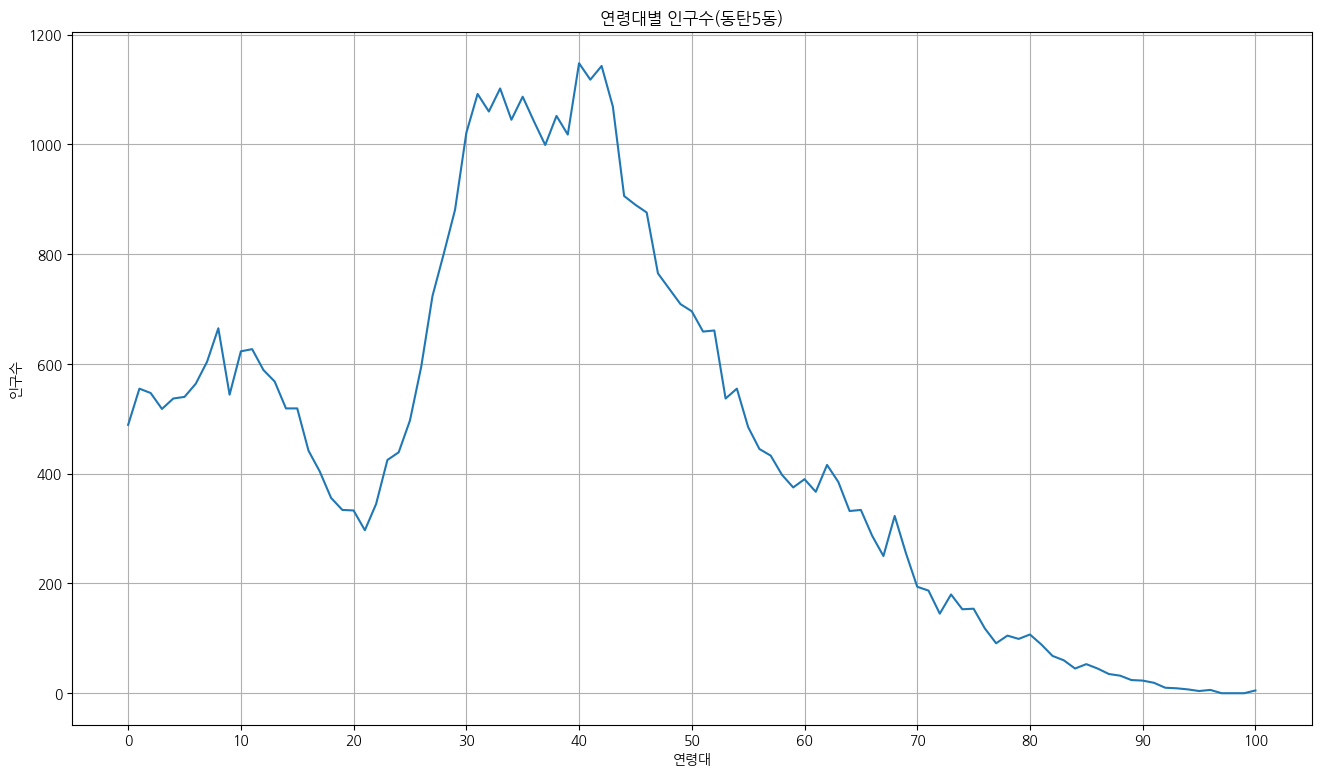
plt.figure(figsize=(16,9))
plt.plot(population)

##### Look at me #####
x_tick = list(range(0, 101, 10))
plt.xticks(x_tick)
######################

plt.xlabel('연령대')
plt.ylabel('인구수')
plt.title('연령대별 인구수({})'.format(name))
plt.grid()
plt.show()
1.2 우리 동네 인구 구조bar() 그래프로 표현
import csv
f = open('age.csv', encoding='cp949')
data = csv.reader(f)
next(data)

population = []

for row in data:
    if '동백2동' in row[0]:
        for number in row[3:]:
            population.append(int(number.replace(',','')))
        break
f.close()

plt.figure(figsize = (16,9))
plt.bar(range(101), population)
plt.grid()
plt.show()

barh()
import csv
f = open('age.csv', encoding='cp949')
data = csv.reader(f)
next(data)

population = []

for row in data:
    if '동백2동' in row[0]:
        for number in row[3:]:
            population.append(int(number.replace(',','')))
        break
f.close()

plt.figure(figsize = (16,9))
plt.barh(range(101), population)
plt.grid()
plt.show()

1 .3 우리 동네 인구 구조 항아리 모양 그래프로 나타내기
데이터 가져오기
import csv
import matplotlib.pyplot as plt

f = open('gender_202306.csv', encoding='cp949')
data = csv.reader(f)
next(data)
['행정구역',
'2023년06월_남_총인구수',
'2023년06월_남_연령구간인구수',
'2023년06월_남_0~9세
겹친 막대그래프
import csv
import matplotlib.pyplot as plt
import koreanize_matplotlib

f = open('gender_202306.csv', encoding='cp949')
data = csv.reader(f)
next(data)

man_population =[]
woman_population =[]

for row in data:
  if '동탄5동' in row[0]:
    for number in row[3:14]:
      man_population.append( int(number.replace(',','')) )
    for number in row[16:]:
      woman_population.append( int(number.replace(',','')) )

f.close()

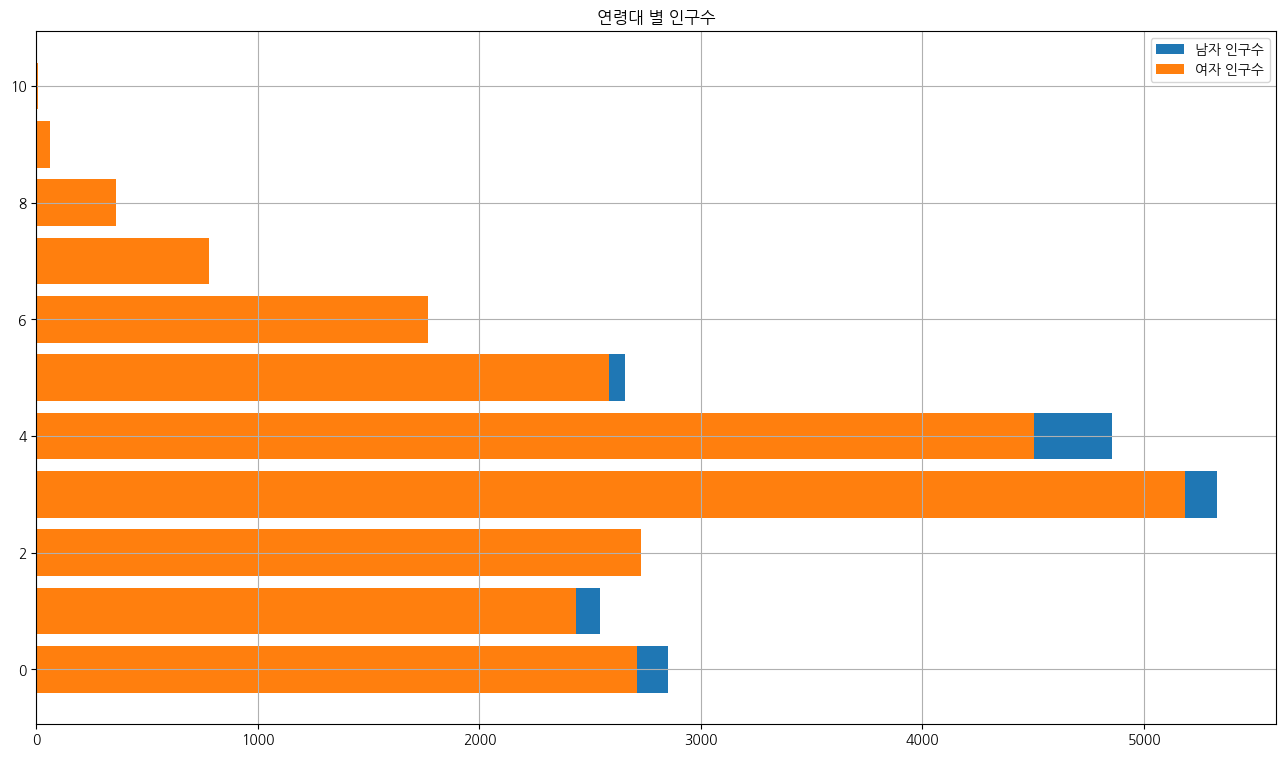
plt.figure(figsize=(16,9))
plt.barh(range(11), man_population, label='남자 인구수')
plt.barh(range(11), woman_population, label='여자 인구수')
plt.title('연령대 별 인구수')
plt.legend()
plt.grid()
plt.show()
다른 형태의 그래프
- man_population.append( -1 * int(number.replace(',','')) ) 로 변경
import csv
import matplotlib.pyplot as plt

f = open('gender_202306.csv', encoding='cp949')
data = csv.reader(f)
next(data)

man_population =[]
woman_population =[]

for row in data:
  if '동탄5동' in row[0]:
    for number in row[3:14]:
      man_population.append( -1*int(number.replace(',','')) )
    for number in row[16:]:
      woman_population.append( int(number.replace(',','')) )

f.close()

plt.figure(figsize=(16,9))
plt.barh(range(11), man_population, label='남자 인구수')
plt.barh(range(11), woman_population, label='여자 인구수')
plt.title('연령대 별 인구수')
plt.legend()
plt.grid()
plt.show()

y축 눈금 단위 조정
import csv
import matplotlib.pyplot as plt

f = open('gender_202306.csv', encoding='cp949')
data = csv.reader(f)
next(data)

man_population =[]
woman_population =[]

for row in data:
  if '동탄5동' in row[0]:
    for number in row[3:14]:
      man_population.append( -1*int(number.replace(',','')) )
    for number in row[16:]:
      woman_population.append( int(number.replace(',','')) )

f.close()

plt.figure(figsize=(16,9))
plt.barh(range(11), man_population, label='남자 인구수')
plt.barh(range(11), woman_population, label='여자 인구수')

# --- 이전 코드에 추가한 부분
y_tick = list(range(0, 11))
plt.yticks(y_tick)
# ---------------------------

plt.title('연령대 별 인구수')
plt.legend()
plt.grid()
plt.show()

subplot()
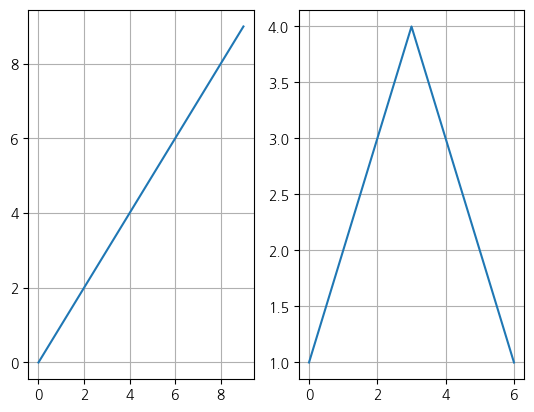
plt.subplot(1, 2, 1)
plt.plot(range(10), range(10))
plt.grid()

plt.subplot(1, 2, 2)
plt.plot([1, 2, 3, 4, 3, 2, 1])
plt.grid()
plt.show()
부산광역시 전체와 서울특별시 전체의 인구 분포를 비교
import csv
import matplotlib.pyplot as plt

f = open('gender_202306.csv', encoding='cp949')
data = csv.reader(f)
next(data)

busan_man_population =[]
busan_woman_population =[]
seoul_man_population =[]
seoul_woman_population=[]

for row in data:
  if '부산광역시  (2600000000)' in row[0]:
    for number in row[3:14]:
      busan_man_population.append( -1*int(number.replace(',','')) )
    for number in row[16:]:
      busan_woman_population.append( int(number.replace(',','')) )
  if '서울특별시  (1100000000)' in row[0]:
    for number in row[3:14]:
      seoul_man_population.append( -1*int(number.replace(',','')) )
    for number in row[16:]:
      seoul_woman_population.append( int(number.replace(',','')) )

f.close()

plt.figure(figsize=(16,9))

plt.subplot(2,1,1)
plt.barh(range(11), busan_man_population, label='남자 인구수')
plt.barh(range(11), busan_woman_population, label='여자 인구수')
y_tick = list(range(0, 11))
plt.yticks(y_tick)
plt.title('연령대 별 인구수(부산)')
plt.legend()
plt.grid()

plt.subplot(2,1,2)
plt.barh(range(11), seoul_man_population, label='남자 인구수')
plt.barh(range(11), seoul_woman_population, label='여자 인구수')
y_tick = list(range(0, 11))
plt.yticks(y_tick)
plt.title('연령대 별 인구수(서울)')
plt.legend()
plt.grid()
plt.show()

x축 범위 동일하게 변경
import csv
import matplotlib.pyplot as plt

f = open('gender_202307.csv', encoding='cp949')
data = csv.reader(f)
next(data)

busan_man_population =[]
busan_woman_population =[]
seoul_man_population =[]
seoul_woman_population=[]

for row in data:
  if '부산광역시  (2600000000)' in row[0]:
    for number in row[3:14]:
      busan_man_population.append( -1*int(number.replace(',','')) )
    for number in row[16:]:
      busan_woman_population.append( int(number.replace(',','')) )
  if '서울특별시  (1100000000)' in row[0]:
    for number in row[3:14]:
      seoul_man_population.append( -1*int(number.replace(',','')) )
    for number in row[16:]:
      seoul_woman_population.append( int(number.replace(',','')) )

f.close()

plt.figure(figsize=(16,9))

plt.subplot(2,1,1)
plt.barh(range(11), seoul_man_population, label='남자 인구수')
plt.barh(range(11), seoul_woman_population, label='여자 인구수')
y_tick = list(range(0, 11))
plt.yticks(y_tick)

#############   추가된 코드
plt.xlim([-800000, 800000])
####################################
plt.title('연령대 별 인구수(서울)')
plt.legend()
plt.grid()

plt.subplot(2,1,2)
plt.barh(range(11), busan_man_population, label='남자 인구수')
plt.barh(range(11), busan_woman_population, label='여자 인구수')
y_tick = list(range(0, 11))
plt.yticks(y_tick)

################## 추가된 코드
plt.xlim([-800000, 800000])
######################################
plt.title('연령대 별 인구수(부산)')
plt.legend()
plt.grid()

plt.show()

1.4 우리 동네 인구 구조 파이pie() 차트로 그리기
혈액형 비율 표현
import matplotlib.pyplot as plt
plt.pie([10,20])
#plt.axis('equal')
plt.show()

import matplotlib.pyplot as plt
plt.pie([10, 20, 30, 40])
#plt.axis('equal')
plt.show()

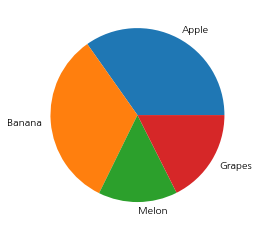
레이블(label) 추가하기
import matplotlib.pyplot as plt
import koreanize_matplotlib

size = [2441, 2312, 1031, 1233]
labels = ['사과', '바나나', '멜론', '포도']
plt.pie(size, labels=labels)
plt.show()

파이 차트의 시작 각도 지정
- 기본 각도는 0도이며 x-축과 일치한다. 첫 번째 요소에 대한 '파이 조각'이 x-축에서 부터 시작한다. 위 이미지에서 첫 번째 요소인 '사과'는 x-축 방향에서 시작했다. 아래 코드(startange=90)에 의한 파이 차트는 x-축을 기준으로 90도 이동하여 사과에 대한 '파이 조각'이 시작되었다.
import matplotlib.pyplot as plt
import koreanize_matplotlib

size = [2441, 2312, 1031, 1233]
labels = ['사과', '바나나', '멜론', '포도']
plt.pie(size, labels=labels, startangle=90)
plt.show()

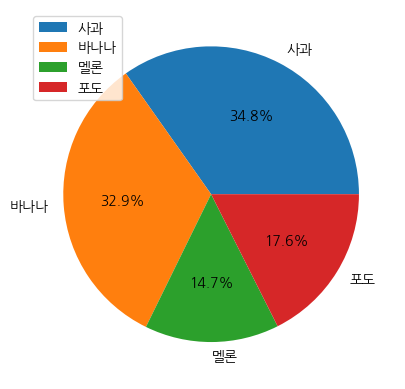
비율 및 범례 표시하기
import matplotlib.pyplot as plt
import koreanize_matplotlib

size = [2441, 2312, 1031, 1233]
labels = ['사과', '바나나', '멜론', '포도']
plt.pie(size, labels=labels, autopct='%.1f%%')
plt.legend()
plt.show()
색 및 돌출 효과 지정하기
다양한 색 이름은 여기에서 확인
import matplotlib.pyplot as plt
import koreanize_matplotlib

size = [2441, 2312, 1031, 1233]
labels = ['사과', '바나나', '멜론', '포도']
colors = ['darkmagenta', 'deeppink', 'hotpink', 'pink']
plt.pie(size, labels=labels, autopct='%.1f%%', colors = colors)
plt.legend()
plt.show()

강조 하고 싶은 '파이 조각' 을 돌출 시키는 방법
import matplotlib.pyplot as plt
import koreanize_matplotlib

size = [2441, 2312, 1031, 1233]
labels = ['사과', '바나나', '멜론', '포도']
colors = ['darkmagenta', 'deeppink', 'hotpink', 'pink']
plt.pie(size, labels=labels, autopct='%.1f%%', colors = colors, explode=(0, 0, 0.1, 0))
plt.legend()
plt.show()

부채꼴 스타일 지정
import matplotlib.pyplot as plt
import koreanize_matplotlib

size = [2441, 2312, 1031, 1233]
labels = ['사과', '바나나', '멜론', '포도']
colors = ['darkmagenta', 'deeppink', 'hotpink', 'pink']

wedgeprops = {'width':0.7, 'edgecolor':'w', 'linewidth':5 }

plt.figure(figsize=(10, 10))
plt.pie(size, labels=labels, autopct='%.1f%%', colors = colors, explode=(0, 0, 0.1, 0), wedgeprops=wedgeprops)
plt.legend()
plt.show()

1.5 제주도 남 녀 인구 비율 표현하기
파이pie() 차트로 표현
import csv
import matplotlib.pyplot as plt

f = open('gender_202306.csv', encoding='cp949')
data = csv.reader(f)
next(data)

man_population = 0
woman_population =0

for row in data:
  if '제주특별자치도  (5000000000)' in row[0]:
    for number in row[3:14]:
      man_population += int(number.replace(',',''))
    for number in row[16:]:
      woman_population += int(number.replace(',',''))
    break

f.close()

plt.figure(figsize=(10,10))
plt.title('제주특별자치도의 남여 인구 비율')
plt.pie([woman_population, man_population], labels=['여자', '남자'], autopct='%.1f%%')
plt.legend()
plt.grid()
plt.show()

import csv
import matplotlib.pyplot as plt

f = open('gender.csv', encoding='cp949')
data = csv.reader(f)
next(data)

man_population = 0
woman_population =0

for row in data:
  if '제주특별자치도  (5000000000)' in row[0]:
    for number in row[3:14]:
      man_population += int(number.replace(',',''))
    for number in row[16:]:
      woman_population += int(number.replace(',',''))
    break

f.close()

plt.figure(figsize=(10,10))
plt.title('제주특별자치도의 남여 인구 비율')
plt.pie([woman_population, man_population], labels=['여자', '남자'], autopct='%.1f%%', startangle=90)
plt.legend()
plt.grid()
plt.show()

- 위 파이 차트에서 글자 크기(font size)가 마음에 안듬. plt.pie()함수에 다음과 같은 설정 값을 전달
import csv
import matplotlib.pyplot as plt

f = open('gender.csv', encoding='cp949')
data = csv.reader(f)
next(data)

man_population = 0
woman_population =0

for row in data:
  if '제주특별자치도  (5000000000)' in row[0]:
    for number in row[3:14]:
      man_population += int(number.replace(',',''))
    for number in row[16:]:
      woman_population += int(number.replace(',',''))

f.close()

plt.figure(figsize=(10,10))
plt.title('제주특별자치도의 남여 인구 비율')
plt.pie([woman_population, man_population], labels=['여자', '남자'], autopct='%.1f%%', startangle=90, textprops={'size':20})
plt.legend()
plt.grid()
plt.show()

1.6 우리 동네 인구 구조 산점도로 나타내기
꺽은선 그래프로 표현
import csv
import matplotlib.pyplot as plt

f = open('gender.csv', encoding='cp949')
data = csv.reader(f)
next(data)

man_population =[]
woman_population =[]

for row in data:
  if '제주특별자치도  (5000000000)' in row[0]:
    for number in row[3:14]:
      man_population.append( int(number.replace(',','')) )
    for number in row[16:]:
      woman_population.append( int(number.replace(',','')) )
    break

f.close()

#plt.figure(figsize=(6,4))
plt.plot(range(11), man_population, 's-', label='male')
plt.plot(range(11), woman_population,'o-', label='female')
x_tick = list(range(0, 11))
plt.xticks(x_tick)

plt.title('제주특별자치도의 남여 인구 분포')
plt.legend()
plt.grid()
plt.show()

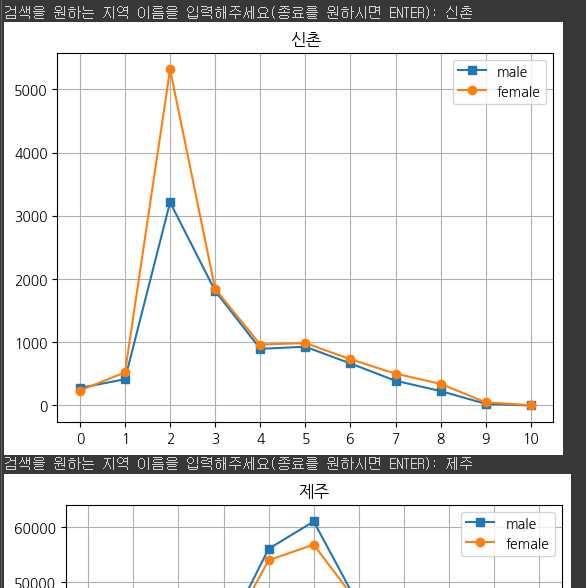
지역 이름'을 입력하면 자동으로 그래프 생성
import csv
import matplotlib.pyplot as plt
import koreanize_matplotlib

f = open('gender_202306.csv', encoding='cp949')        # 파일 오픈
data = csv.reader(f)                            # 파일로부터 데이터 읽어 옴
next(data)                                      # 읽어온 데이터에서 header 부분 삭제
data_bank = list(data)                          # 데이터를 리스트 형으로 변환
f.close()                                       # 파일 클로즈

while True:
  name = input('검색을 원하는 지역 이름을 입력해주세요(종료를 원하시면 ENTER): ')
  plt.close()
  if name == 'q':
    break

  man_population =[]
  woman_population =[]

  for row in data_bank:
    if name in row[0]:
      for number in row[3:14]:
        man_population.append( int(number.replace(',','')) )
      for number in row[16:]:
        woman_population.append( int(number.replace(',','')) )
      break

  plt.plot(range(11), man_population, 's-', label='male')
  plt.plot(range(11), woman_population,'o-', label='female')
  x_tick = list(range(0, 11))
  plt.xticks(x_tick)
  plt.title(name)
  plt.legend()
  plt.grid()
  plt.show()
산점도로 표현
# 도미의 특성(feature)으로 길이와 무게를 고려함
bream_length = [25.4, 26.3, 26.5, 29.0, 29.0, 29.7, 29.7, 30.0, 30.0, 30.7, 31.0, 31.0,
                31.5, 32.0, 32.0, 32.0, 33.0, 33.0, 33.5, 33.5, 34.0, 34.0, 34.5, 35.0,
                35.0, 35.0, 35.0, 36.0, 36.0, 37.0, 38.5, 38.5, 39.5, 41.0, 41.0]
bream_weight = [242.0, 290.0, 340.0, 363.0, 430.0, 450.0, 500.0, 390.0, 450.0, 500.0, 475.0, 500.0,
                500.0, 340.0, 600.0, 600.0, 700.0, 700.0, 610.0, 650.0, 575.0, 685.0, 620.0, 680.0,
                700.0, 725.0, 720.0, 714.0, 850.0, 1000.0, 920.0, 955.0, 925.0, 975.0, 950.0]

# 길이(length)의 단위는 [cm]
# 무게(weight)의 단위는 [g] (그람)

import matplotlib.pyplot as plt
import koreanize_matplotlib

plt.scatter(bream_length, bream_weight)     # 첫 번째 인자는 수평 축(길이), 두 번째 인자는 수직 축(무게)
plt.xlabel('length [cm]')                   # x 축은 도미의 길이
plt.ylabel('weight [g]')                    # y 축은 도미의 무게
plt.title('도미의 길이 vs. 무게')
plt.grid()
plt.show()

'빅데이터 분석가 양성과정 > Python' 카테고리의 다른 글
| 대중교통 데이터 (0) | 2024.07.10 |
|---|---|
| 기온 공공 데이터 (2) | 2024.07.10 |
| '한국인의 삶 파악하기' 분석 (1) | 2024.07.10 |
| 데이터 가공하기 (0) | 2024.07.10 |
| 외부 데이터 활용 (0) | 2024.07.10 |
