
EDA에서는 다음과 같은 항목을 살펴봅니다.
- 기본적인 빈도 분석
- 히스토그램
- Pie chart와 같은 plotting 기법들
Q5 column
- Select the title most similar to your current role
Q5 = final_data["Q5"][1:]; Q5
Q5.value_counts()plt.figure(figsize=(12, 12))
#plt.hist(Q5)
plt.barh(Q5.value_counts().index, Q5.value_counts().values)
plt.xticks(rotation='vertical')
plt.title("Histogram for Q5 column")
plt.show()
plt.figure(figsize=(16, 16))
plt.pie(Q5.value_counts(),
labels=Q5.value_counts().index,
autopct='%d%%',
textprops={'fontsize':24})
plt.axis('equal')
plt.title("Pie chart for Q5 column", fontsize=48, pad=50)
plt.show()
Q20 column
- What is the size of the compnay where are employed?
Q20 = final_data["Q20"][1:]
Q20.value_counts()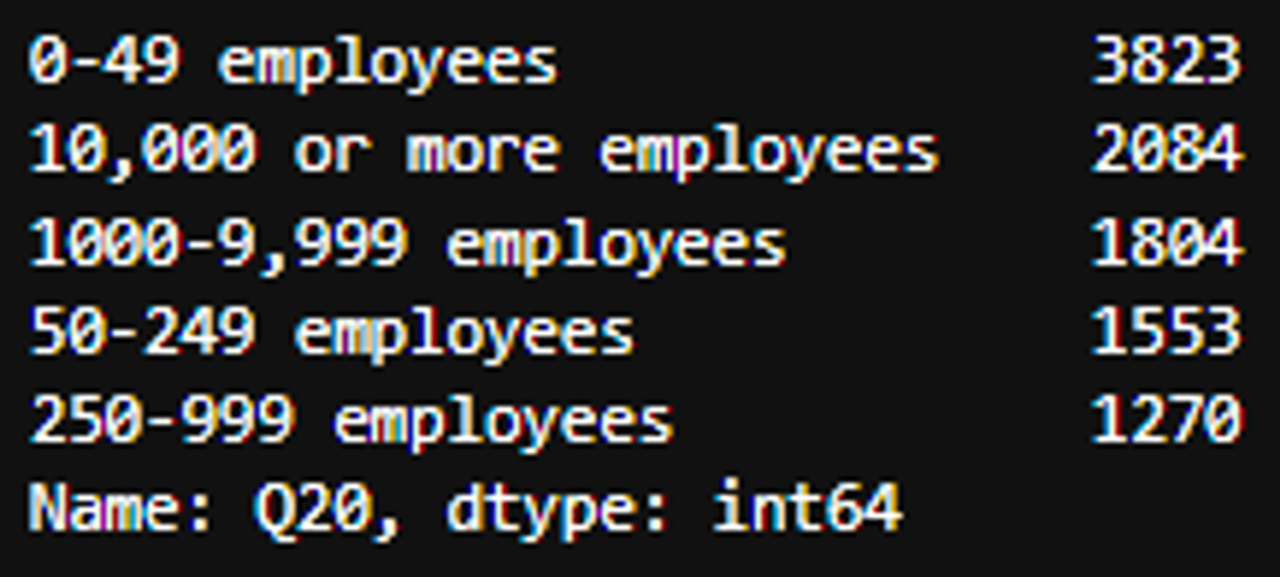
# sns.countplot을 사용해봅시다.
sns.countplot(y="Q20", data=final_data[1:])
plt.show()
plt.figure(figsize=(8,8))
plt.pie(Q20.value_counts(),
labels=Q20.value_counts().index,
autopct='%d%%',
colors=sns.color_palette('hls',len(Q20.value_counts().index)),
textprops={'fontsize':16})
plt.axis('equal')
plt.title("Pie chart for Q20 column", fontsize=32, pad=50)
plt.show()
Q22 column
- Does your current employer incorporate machine learning methods into their business?
Q22 = final_data["Q22"][1:]
Q22.value_counts()
plt.figure(figsize=(12, 16))
# To-Do
plt.barh(Q22.value_counts().index, Q22.value_counts().values)
plt.show()
plt.figure(figsize=(12, 12))
plt.pie(Q22.value_counts(),
labels=Q22.value_counts().index,
autopct='%.2f%%',
colors=sns.color_palette('hls',len(Q22.value_counts().index)),
textprops={'fontsize':12})
plt.axis('equal')
plt.title("Pie chart for Q22 column", fontsize=32, pad=50)
plt.show()
Q3
- In which country do you currently reside?
# (OPTIONAL)
#set(data["Q3"]) # --> "Republic of Korea" / "South Korea"
skorea = data[data["Q3"].isin(["Republic of Korea", "South Korea"])]
skorea.head()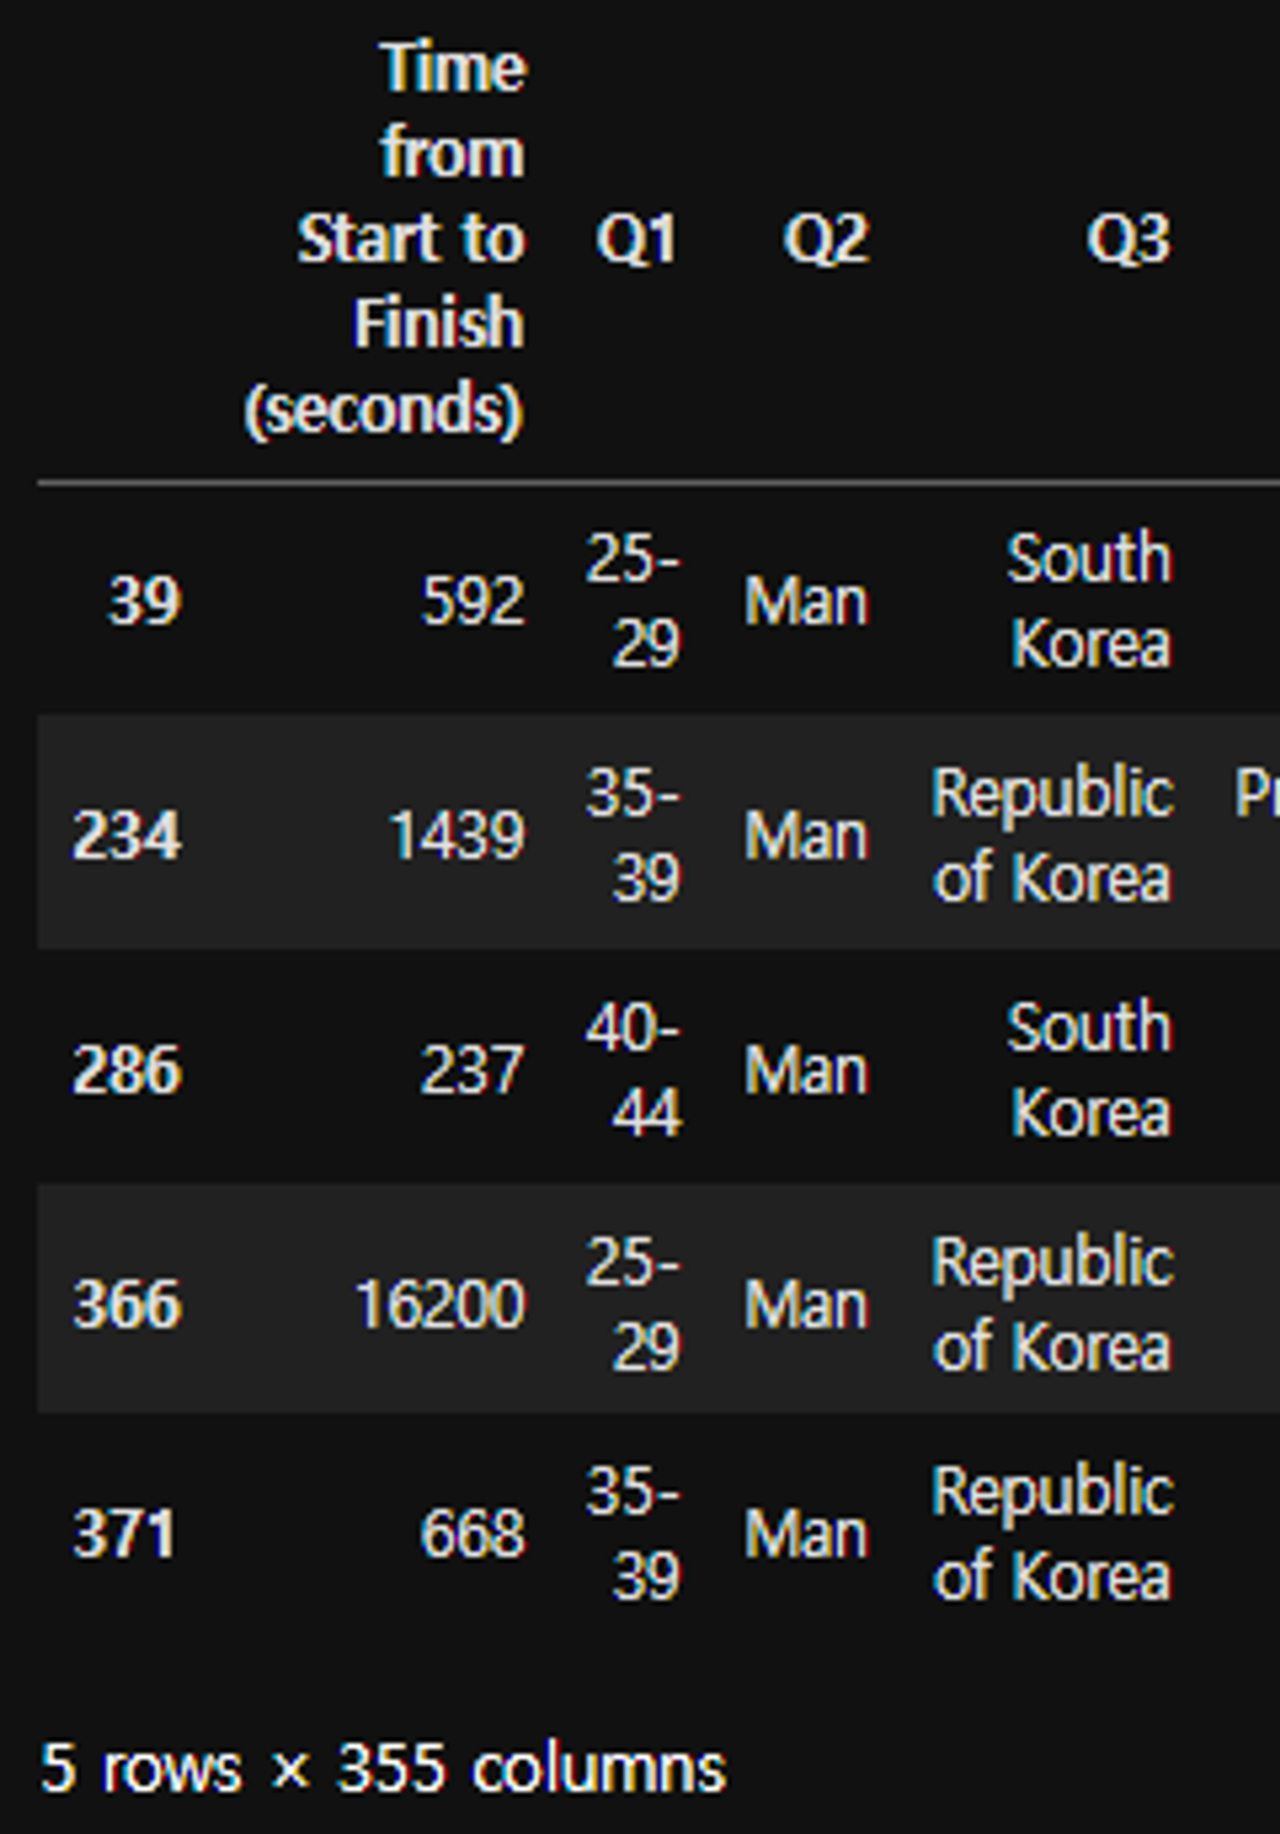
sQ4 = skorea["Q4"]
sQ4.value_counts()
sns.countplot(y="Q4", data=skorea[1:])
plt.show()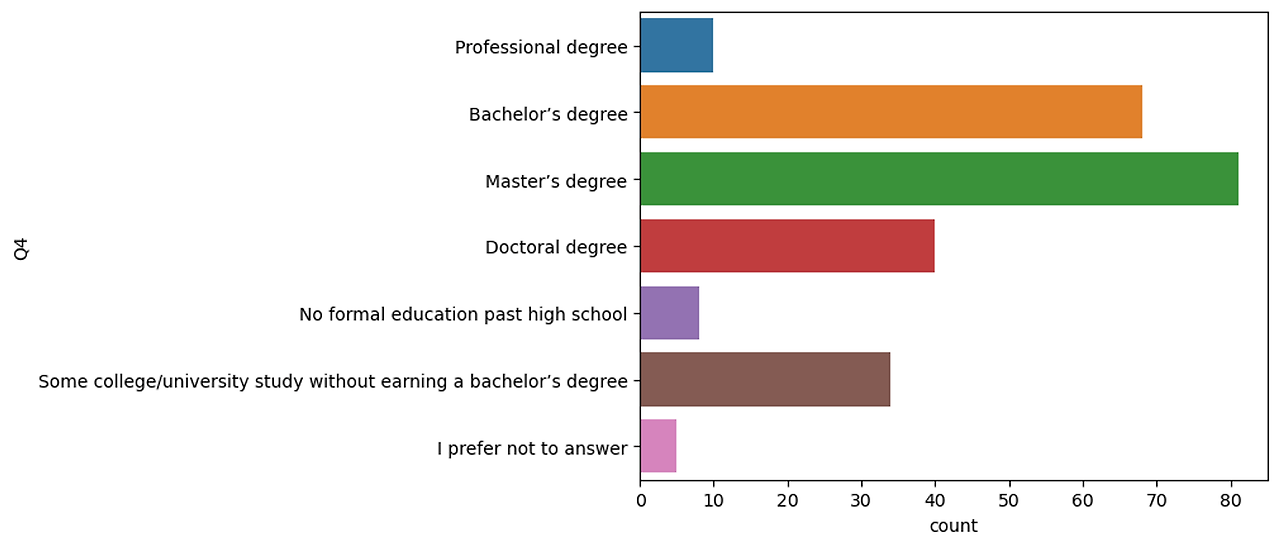
plt.figure(figsize=(12, 12))
plt.pie(sQ4.value_counts(),
labels=sQ4.value_counts().index,
autopct='%.2f%%',
colors=sns.color_palette('hls',len(sQ4.value_counts().index)),
textprops={'fontsize':12})
plt.axis('equal')
plt.title("Pie chart for Q4 column in South Korea", fontsize=32, pad=50)
plt.show()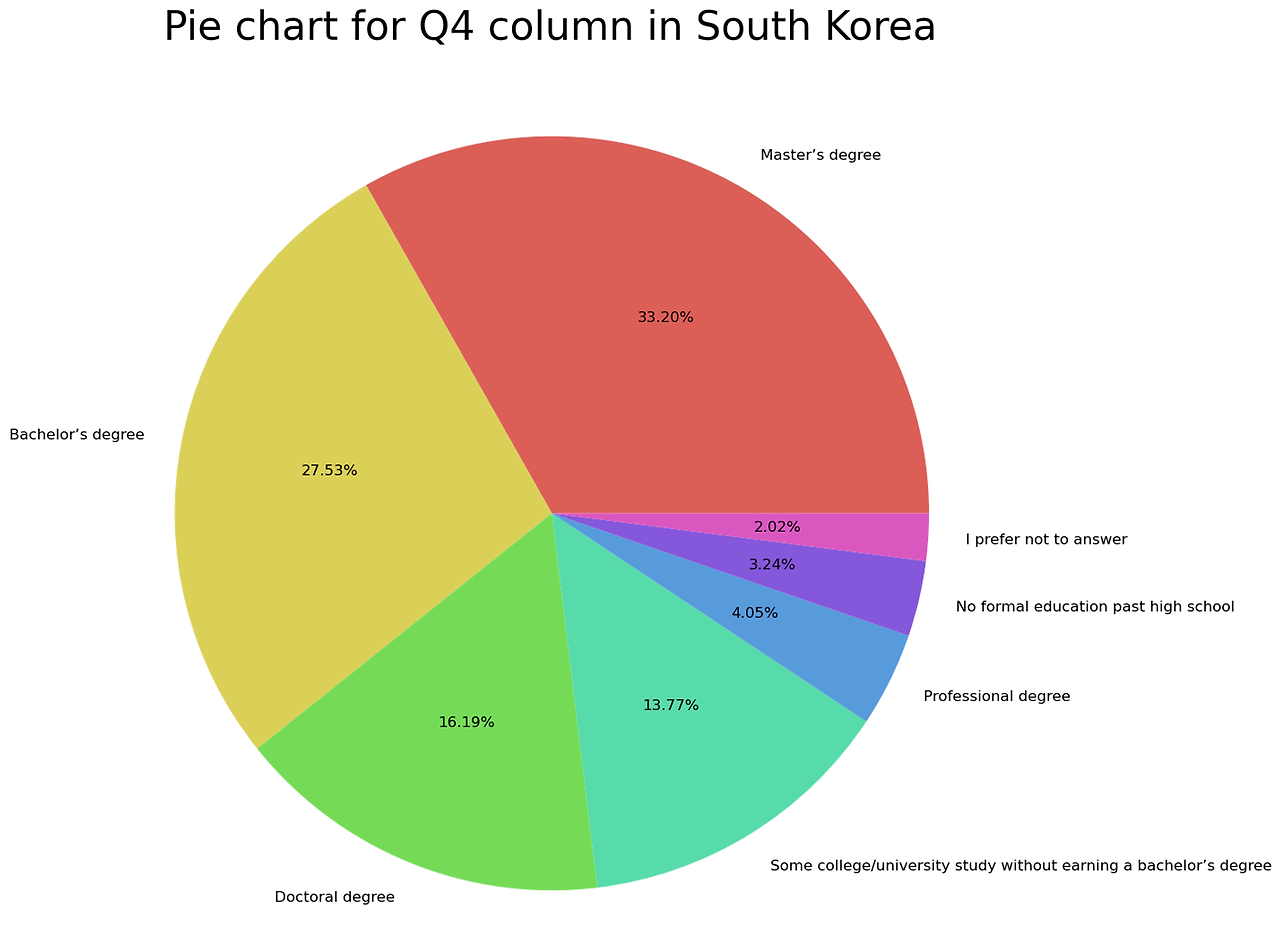
'빅데이터 분석가 양성과정 > Python' 카테고리의 다른 글
| 공공데이터 분석(커피전문점) - View data (0) | 2024.07.08 |
|---|---|
| 공공데이터 분석(커피전문점) - Load Data (0) | 2024.07.08 |
| Seaborn - Kaggle Survey EDA(1) (0) | 2024.07.08 |
| Seaborn - Mushrooms DataSet (1) | 2024.07.08 |
| Seaborn - Penguins Dataset ( Heatmap ) (0) | 2024.07.08 |
EDA에서는 다음과 같은 항목을 살펴봅니다.
- 기본적인 빈도 분석
- 히스토그램
- Pie chart와 같은 plotting 기법들
Q5 column
- Select the title most similar to your current role
python
Q5 = final_data["Q5"][1:]; Q5
Q5.value_counts()
python
plt.figure(figsize=(12, 12))
#plt.hist(Q5)
plt.barh(Q5.value_counts().index, Q5.value_counts().values)
plt.xticks(rotation='vertical')
plt.title("Histogram for Q5 column")
plt.show()
python
plt.figure(figsize=(16, 16))
plt.pie(Q5.value_counts(),
       labels=Q5.value_counts().index,
       autopct='%d%%',
       textprops={'fontsize':24})
plt.axis('equal')
plt.title("Pie chart for Q5 column", fontsize=48, pad=50)
plt.show()Q20 column
- What is the size of the compnay where are employed?
python
Q20 = final_data["Q20"][1:]
Q20.value_counts()
# sns.countplot을 사용해봅시다.
sns.countplot(y="Q20", data=final_data[1:])
plt.show()
python
plt.figure(figsize=(8,8))
plt.pie(Q20.value_counts(),
       labels=Q20.value_counts().index,
       autopct='%d%%',
        colors=sns.color_palette('hls',len(Q20.value_counts().index)),
       textprops={'fontsize':16})
plt.axis('equal')
plt.title("Pie chart for Q20 column", fontsize=32, pad=50)
plt.show()Q22 column
- Does your current employer incorporate machine learning methods into their business?
python
Q22 = final_data["Q22"][1:]
Q22.value_counts()
plt.figure(figsize=(12, 16))
# To-Do
plt.barh(Q22.value_counts().index, Q22.value_counts().values)
plt.show()
plt.figure(figsize=(12, 12))
plt.pie(Q22.value_counts(),
       labels=Q22.value_counts().index,
       autopct='%.2f%%',
        colors=sns.color_palette('hls',len(Q22.value_counts().index)),
       textprops={'fontsize':12})
plt.axis('equal')
plt.title("Pie chart for Q22 column", fontsize=32, pad=50)
plt.show()Q3
- In which country do you currently reside?
# (OPTIONAL)
#set(data["Q3"]) # --> "Republic of Korea" / "South Korea"
skorea = data[data["Q3"].isin(["Republic of Korea", "South Korea"])]
skorea.head()
sQ4 = skorea["Q4"]
sQ4.value_counts()
sns.countplot(y="Q4", data=skorea[1:])
plt.show()
plt.figure(figsize=(12, 12))
plt.pie(sQ4.value_counts(),
       labels=sQ4.value_counts().index,
       autopct='%.2f%%',
        colors=sns.color_palette('hls',len(sQ4.value_counts().index)),
       textprops={'fontsize':12})
plt.axis('equal')
plt.title("Pie chart for Q4 column in South Korea", fontsize=32, pad=50)
plt.show()'빅데이터 분석가 양성과정 > Python' 카테고리의 다른 글
| 공공데이터 분석(커피전문점) - View data (0) | 2024.07.08 |
|---|---|
| 공공데이터 분석(커피전문점) - Load Data (0) | 2024.07.08 |
| Seaborn - Kaggle Survey EDA(1) (0) | 2024.07.08 |
| Seaborn - Mushrooms DataSet (1) | 2024.07.08 |
| Seaborn - Penguins Dataset ( Heatmap ) (0) | 2024.07.08 |