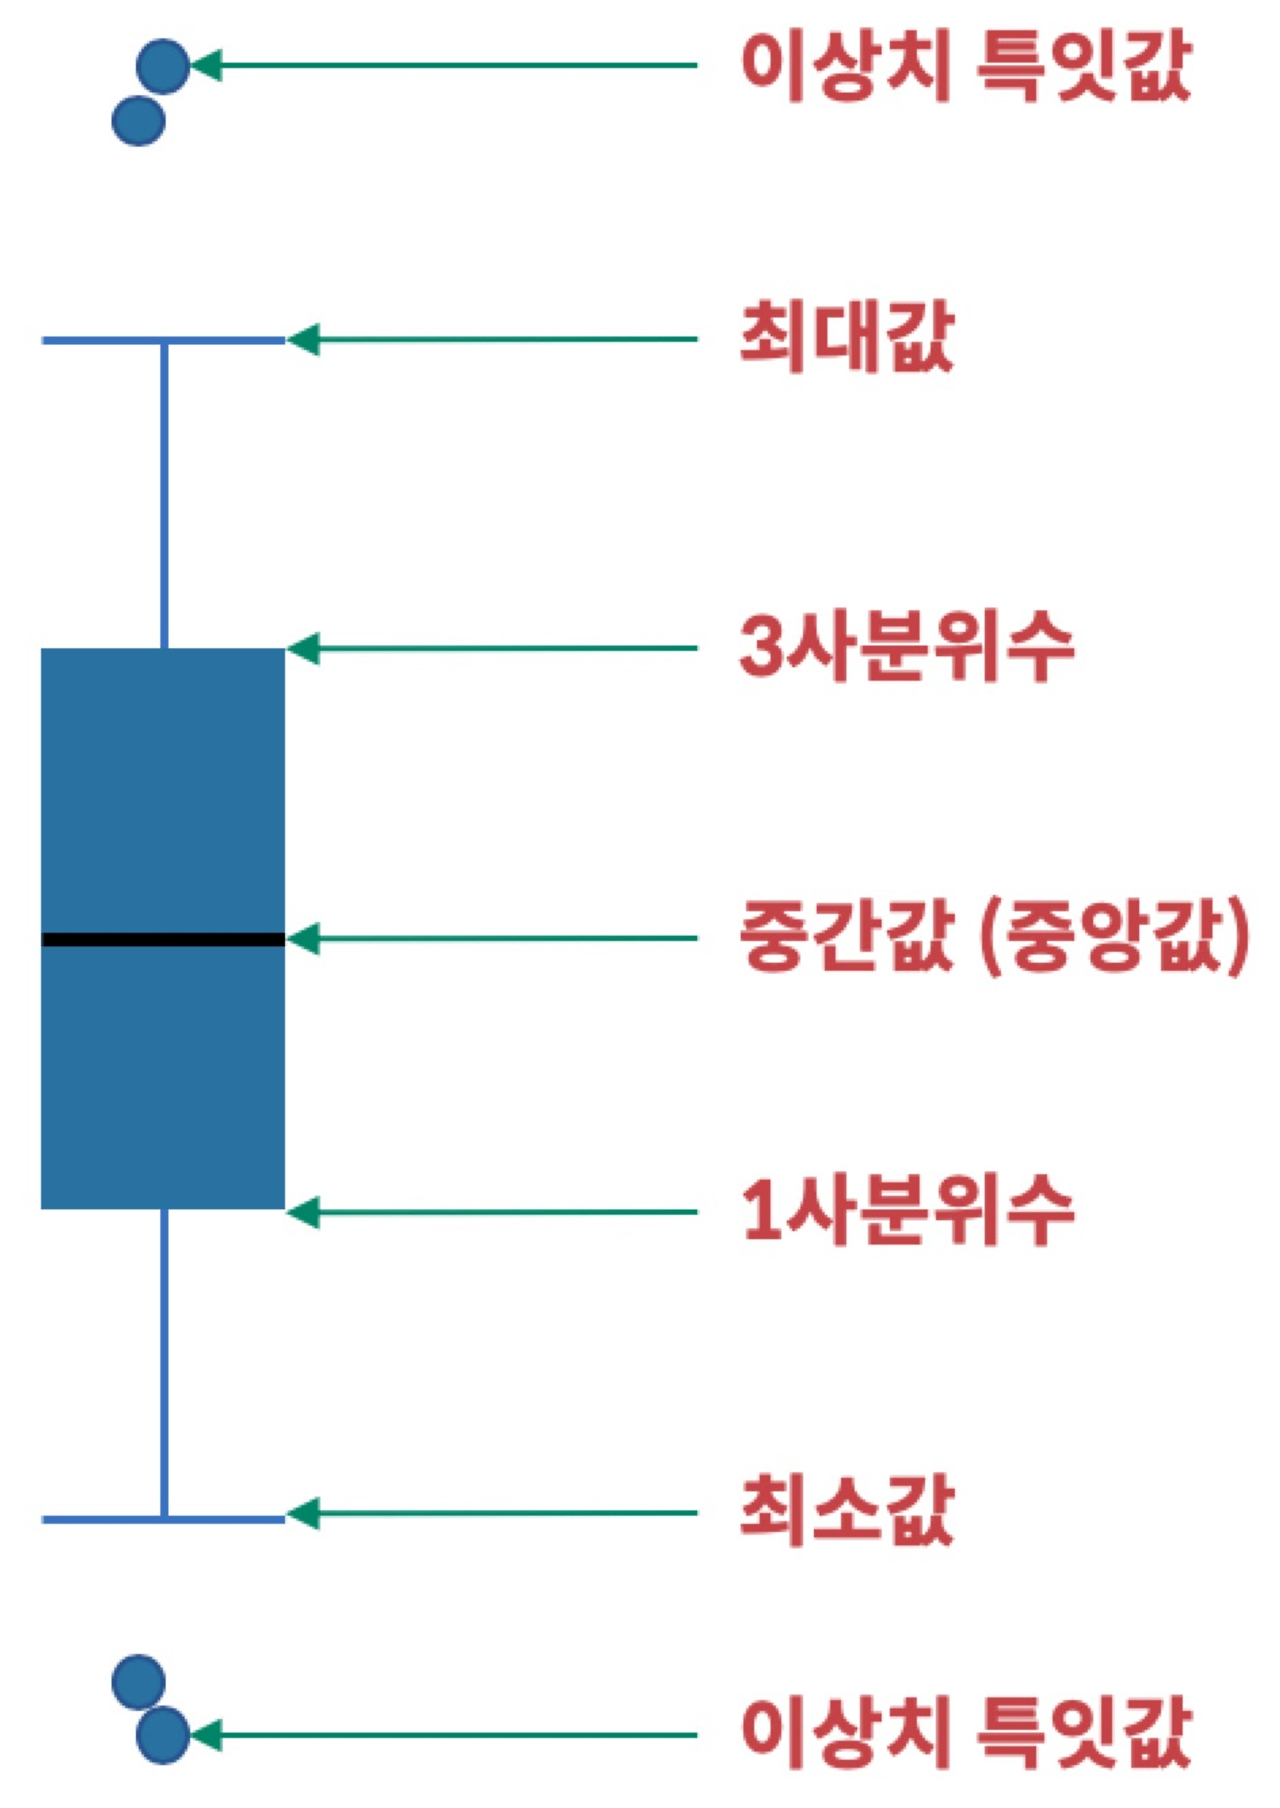
4. 분석 타입에 따른 그래프 종류 이해: 다섯 수치 요약 (5 number summary)과 특잇값 확인
상자 그래프 (boxplot)
import chart_studio.plotly as py
import cufflinks as cf
cf.go_offline(connected=True)- 그래프 종류 확인
cf.help()iplot 으로 그려보기
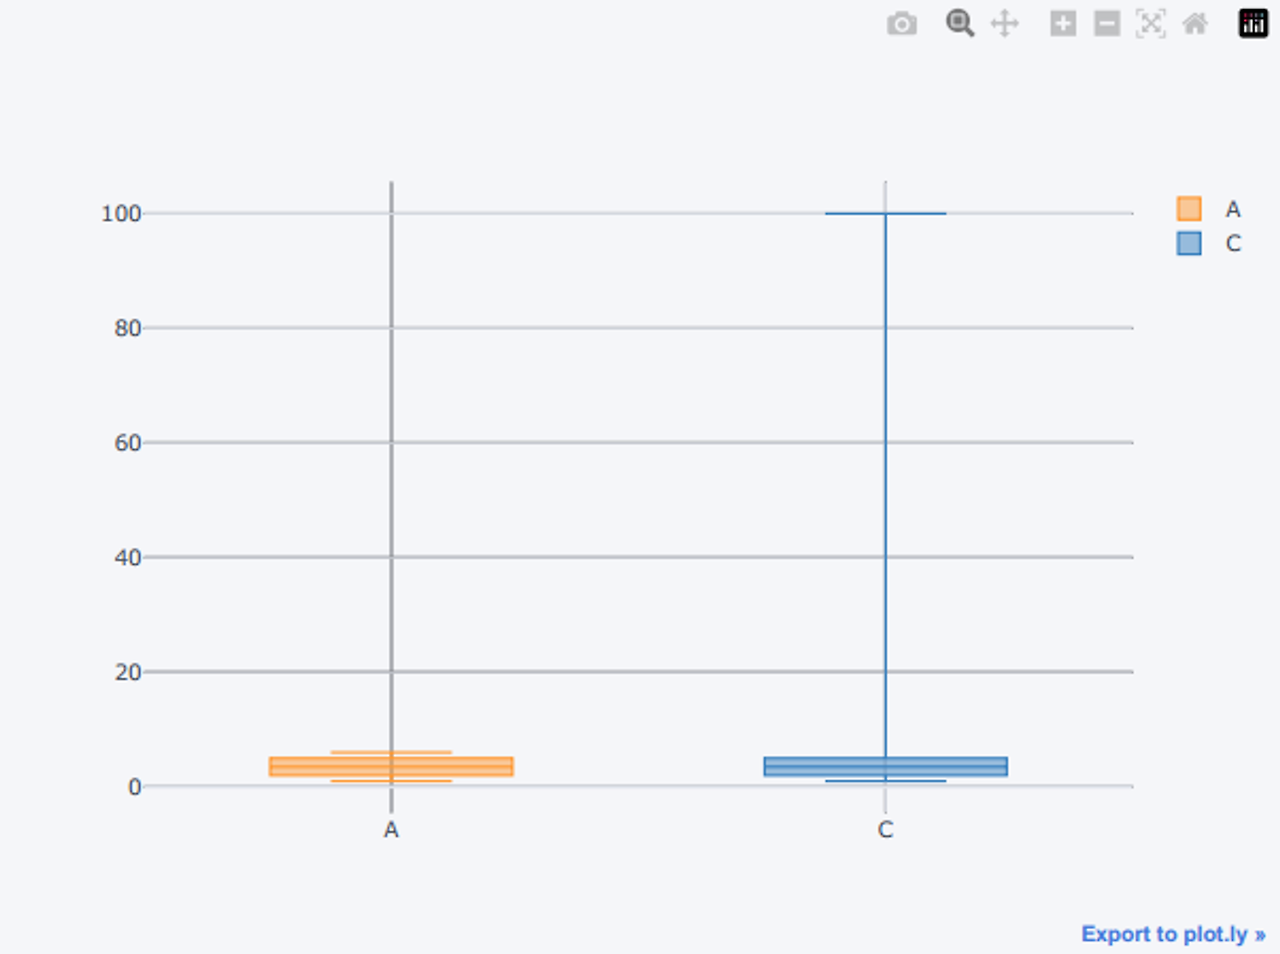
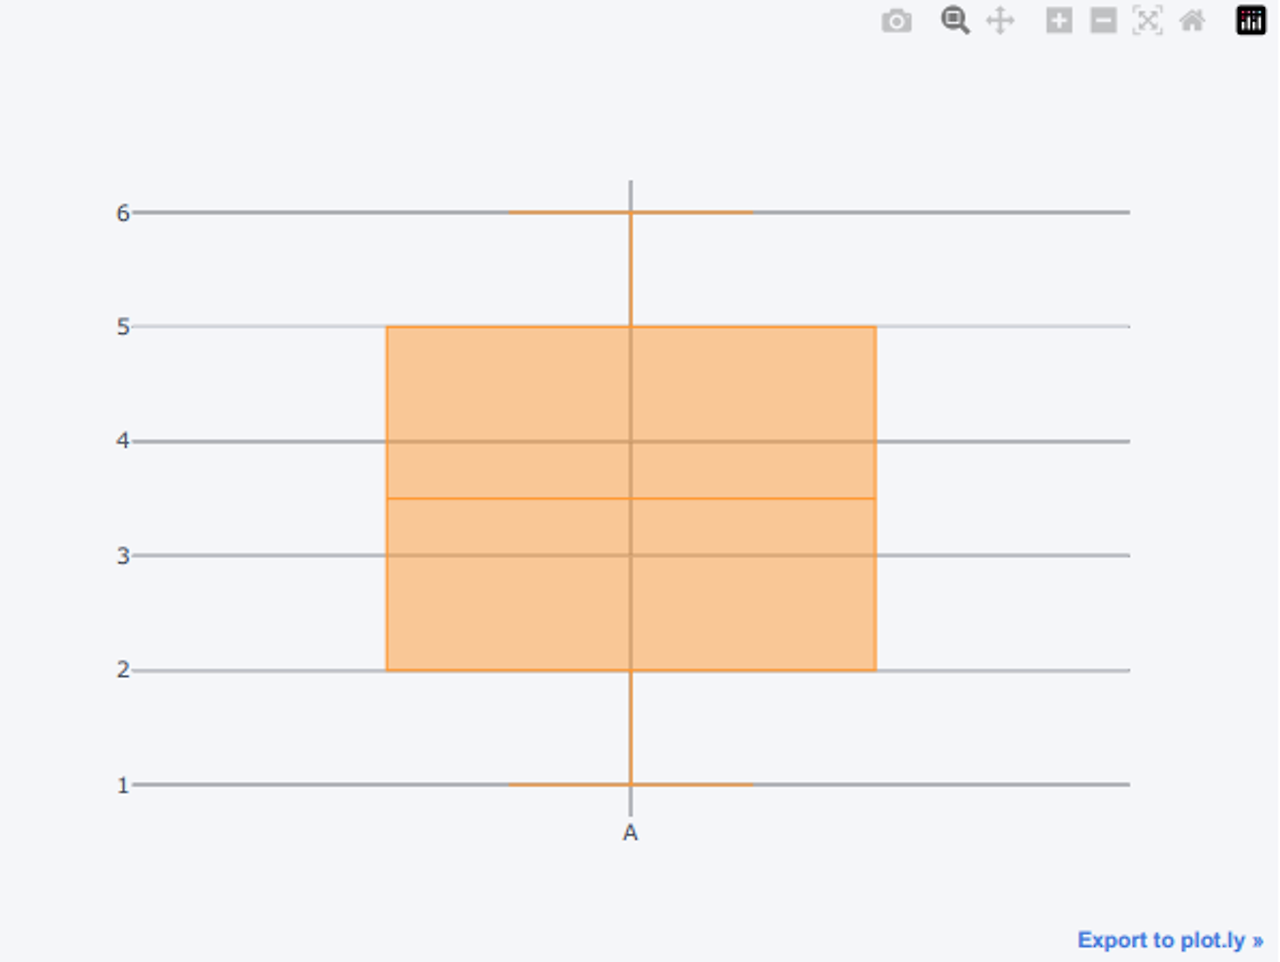
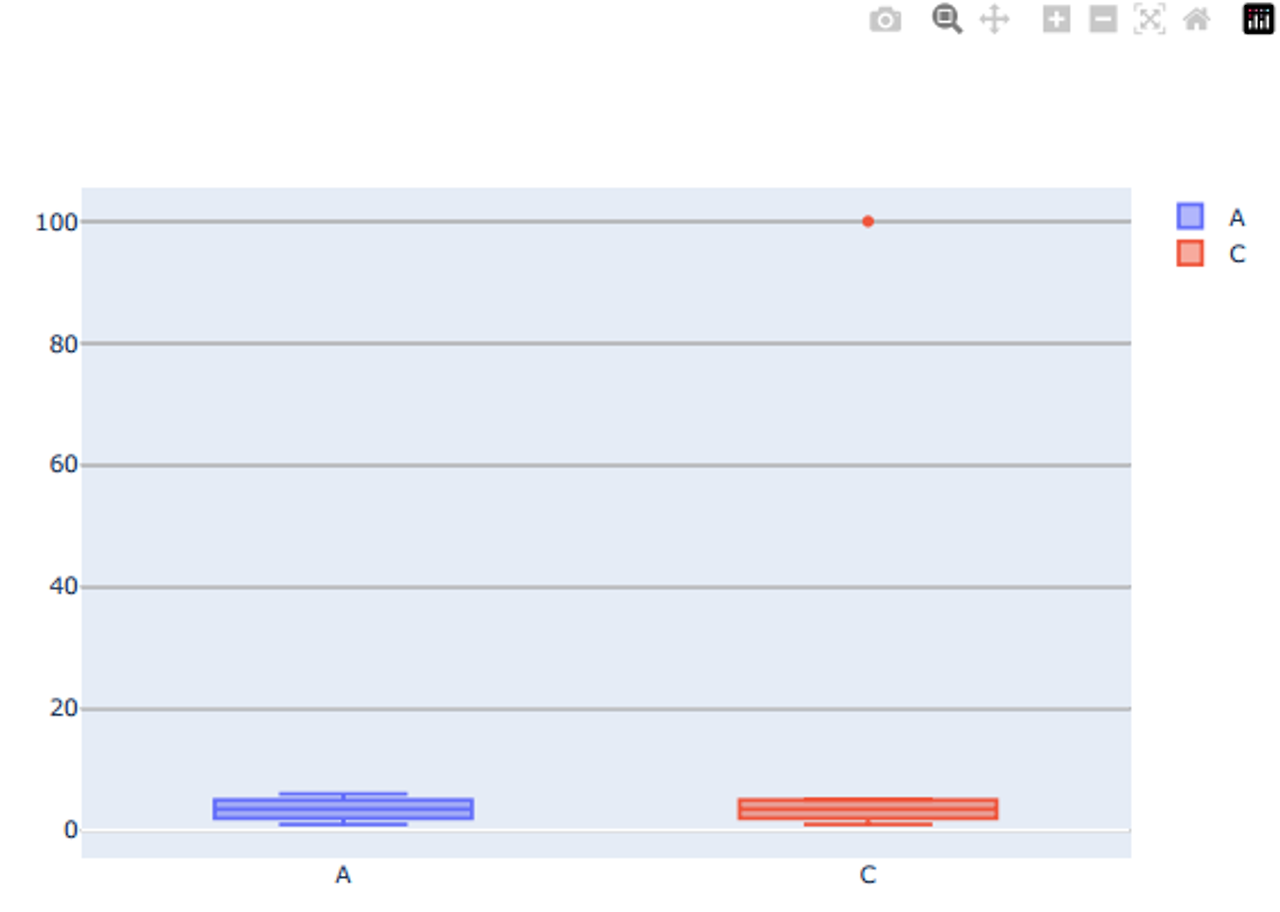
df.iplot(kind='box')df['A'].iplot(kind='box')plotly.graph_objects 로 그려보기
import plotly.graph_objects as go
import plotly.offline as pyo # jupyter notebook 에서 보여지도록 설정하는 부분 (가끔 안나올 때, 이 명령을 하면 됨)
pyo.init_notebook_mode()import plotly.graph_objects as go
fig = go.Figure()
fig.add_trace(
go.Box(
y=df['A'], name='A'
)
)
fig.add_trace(
go.Box(
y=df['C'], name='C'
)
)
fig.show()RANSAC 알고리즘 원리
중학생도 이해할 수 있는 RANSAC 알고리즘 원리
이 글은 RANSAC에 대해 아무것도 알지 못해도, 중학교 이상의 수학적 지식만 가지고 있다면 충분히 이해할 수 있도록 포스팅할 예정이다. 실제로 RANSAC은 매우 중요한 알고리즘이지만 실상 들여다
gnaseel.tistory.com
5. 분석 타입에 따른 그래프 종류 이해: 수치형 데이터 분포를 확인하기 위한 시각화
- 도수분포표 (frequency table): 수치형 데이터를 구간으로 나눠서 각 구간에 속하는 데이터의 갯수를 나타내는 표
- 히스토그램 (histogram) 그래프: 도수 분포표를 시각적으로 표현한 그래프
import numpy as np
import pandas as pd
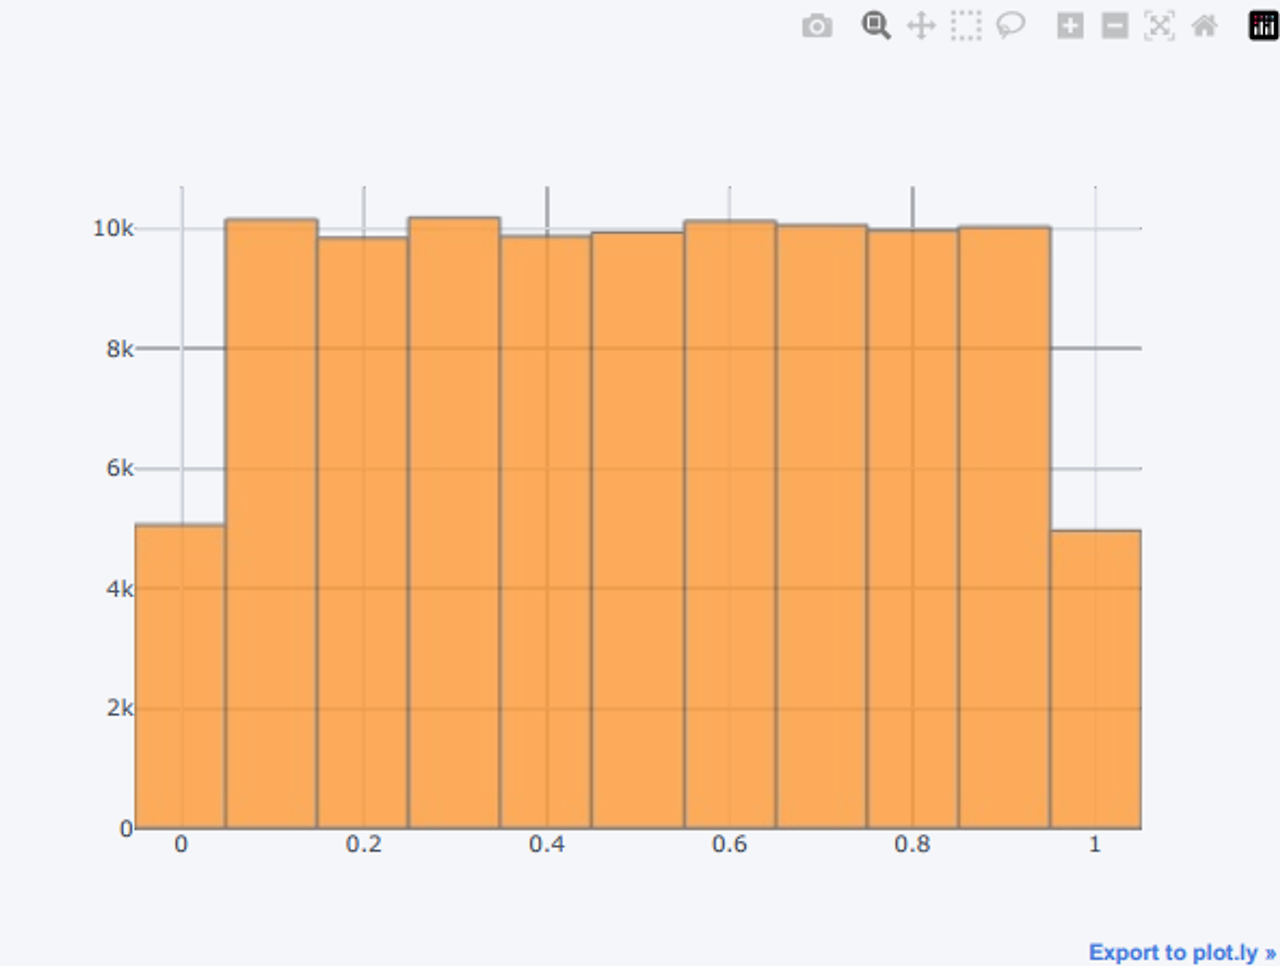
df = pd.DataFrame(np.random.rand(100000, 1), columns=['A'])
df.head()iplot 으로 그려보기
df.iplot(kind='histogram')df.iplot(kind='histogram', bins=10) # 구간을 10개로 나누기plotly.graph_objects 로 그려보기
- 기본 그래프가 너무 예쁘지 않아서, 추가 옵션을 통해 조정했음
- https://plotly.com/python/histograms/
import plotly.graph_objects as go
fig = go.Figure()
fig.add_trace(
go.Histogram(
x=df['A'], name='A',
xbins=dict( # bins used for histogram
start=0,
end=1.0,
size=0.05
),
marker_color='#F50057'
)
)
fig.update_layout(
title_text='Sampled Results', # title of plot
xaxis_title_text='Value', # xaxis label
yaxis_title_text='Count', # yaxis label
bargap=0.1, # gap between bars of adjacent location coordinates
)
fig.show()'빅데이터 분석가 양성과정 > Python' 카테고리의 다른 글
| 시각화 이용한 탐색적 데이터 분석(5) (0) | 2024.07.08 |
|---|---|
| 시각화 이용한 탐색적 데이터 분석(4) (0) | 2024.07.08 |
| 시각화 이용한 탐색적 데이터 분석(2) (1) | 2024.07.08 |
| 시각화 이용한 탐색적 데이터 분석(1) (1) | 2024.07.08 |
| plotly - 막대 그래프 / 세부 요소 변경 (1) | 2024.07.08 |
4. 분석 타입에 따른 그래프 종류 이해: 다섯 수치 요약 (5 number summary)과 특잇값 확인
상자 그래프 (boxplot)
import chart_studio.plotly as py
import cufflinks as cf
cf.go_offline(connected=True)- 그래프 종류 확인
cf.help()iplot 으로 그려보기
df.iplot(kind='box')
df['A'].iplot(kind='box')plotly.graph_objects 로 그려보기
import plotly.graph_objects as go
import plotly.offline as pyo # jupyter notebook 에서 보여지도록 설정하는 부분 (가끔 안나올 때, 이 명령을 하면 됨)
pyo.init_notebook_mode()
import plotly.graph_objects as go
fig = go.Figure()
fig.add_trace(
		go.Box(
				y=df['A'], name='A'
		)
)
fig.add_trace(
		go.Box(
				y=df['C'], name='C'
		)
)
fig.show()RANSAC 알고리즘 원리
중학생도 이해할 수 있는 RANSAC 알고리즘 원리
이 글은 RANSAC에 대해 아무것도 알지 못해도, 중학교 이상의 수학적 지식만 가지고 있다면 충분히 이해할 수 있도록 포스팅할 예정이다. 실제로 RANSAC은 매우 중요한 알고리즘이지만 실상 들여다
gnaseel.tistory.com
5. 분석 타입에 따른 그래프 종류 이해: 수치형 데이터 분포를 확인하기 위한 시각화
- 도수분포표 (frequency table): 수치형 데이터를 구간으로 나눠서 각 구간에 속하는 데이터의 갯수를 나타내는 표
- 히스토그램 (histogram) 그래프: 도수 분포표를 시각적으로 표현한 그래프
import numpy as np
import pandas as pd
df = pd.DataFrame(np.random.rand(100000, 1), columns=['A'])
df.head()iplot 으로 그려보기
df.iplot(kind='histogram')
df.iplot(kind='histogram', bins=10) # 구간을 10개로 나누기plotly.graph_objects 로 그려보기
- 기본 그래프가 너무 예쁘지 않아서, 추가 옵션을 통해 조정했음
- https://plotly.com/python/histograms/
import plotly.graph_objects as go
fig = go.Figure()
fig.add_trace(
		go.Histogram(
				x=df['A'], name='A',
						xbins=dict( # bins used for histogram
								start=0,
								end=1.0,
								size=0.05
						),
				marker_color='#F50057'
		)
)
fig.update_layout(
		title_text='Sampled Results', # title of plot
		xaxis_title_text='Value', # xaxis label
		yaxis_title_text='Count', # yaxis label
		bargap=0.1, # gap between bars of adjacent location coordinates
)
fig.show()'빅데이터 분석가 양성과정 > Python' 카테고리의 다른 글
| 시각화 이용한 탐색적 데이터 분석(5) (0) | 2024.07.08 |
|---|---|
| 시각화 이용한 탐색적 데이터 분석(4) (0) | 2024.07.08 |
| 시각화 이용한 탐색적 데이터 분석(2) (1) | 2024.07.08 |
| 시각화 이용한 탐색적 데이터 분석(1) (1) | 2024.07.08 |
| plotly - 막대 그래프 / 세부 요소 변경 (1) | 2024.07.08 |

